

HOT TOPICS LIST
- MACD
- Fibonacci
- RSI
- Gann
- ADXR
- Stochastics
- Volume
- Triangles
- Futures
- Cycles
- Volatility
- ZIGZAG
- MESA
- Retracement
- Aroon
INDICATORS LIST
LIST OF TOPICS
PRINT THIS ARTICLE
by Gary Grosschadl
Genzyme General, a division of Genzyme, is a Nasdaq 100 stock that appears to be repeating a pattern and may be forming a possible triple top.
Position: Sell
Gary Grosschadl
Independent Canadian equities trader and technical analyst based in Peterborough
Ontario, Canada.
PRINT THIS ARTICLE
CHART ANALYSIS
Genzyme Topping Out
03/25/03 10:52:35 AMby Gary Grosschadl
Genzyme General, a division of Genzyme, is a Nasdaq 100 stock that appears to be repeating a pattern and may be forming a possible triple top.
Position: Sell
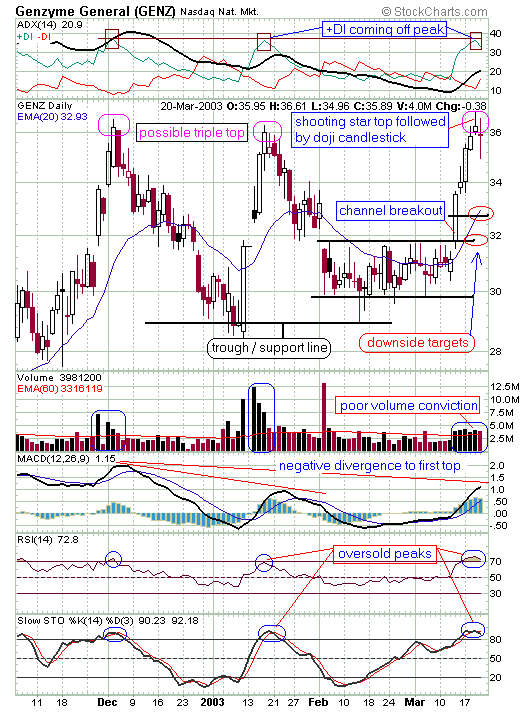
| Ideally a triple top reversal pattern has three equal tops with a trend of diminishing volume. While the tops on Genzyme General (GENZ) are not exactly equal, they're not far off. As for the volume, it has diminished at the third peak, showing poor conviction on the part of buyers. The decline from the third peak should show an increase in volume and this should be watched in the days ahead. Note that a triple top is not actually confirmed until the trough support line is broken, in this case around $29. |
| The pattern's tops have been repeated with rapid uplegs, propelled by gaps with each rise to peak price. This last upleg was a nice breakout from a sideways channel. If this pattern repeats as before, the stock can decline to its 20-day EMA and rest there before continuing further down. The risk for the short-term trader would then be if the stock found good support here and bounced back up. |
|
| Graphic provided by: StockCharts.com. |
| |
| The displayed indicators are also giving some clues. The directional movement indicator (DMI) at the top of the chart (composed of three elements - ADX/DIs) shows the +DI coming off a high value as with previous occurances. It should be noted that the ADX line is still in a bullish position being between the DIs however that was the case as well at the previous peak. The MACD (moving average convergence/divergence) indicator shows negative divergence between the first and second peak and a smaller one between the first and third. This is somewhat downplayed as there is no divergence between the second and third peaks. The RSI (relative strength index) shows an oversold condition and stochastics are also oversold but they should also fall below their respective 70 and 80 levels for added bearish confirmation. |
| The last two candlesticks also suggest a downturn ahead. A shooting star candlestick with its classic long upper shadow (showing weakening buying power) is often a good indicator of a potential top. The next day a doji candle appeared, which shows indecision when it occurs after an upleg. This often indicates a "backing off" of bullish conviction as the bulls and bears appear balanced. Both these candlesticks suggest a loss of bullish momentum which often precludes a change in the trend. The shooting star should have confirmation the next day or two of a coming downtrend with a down day and this doji helps. A surprise move above this doji and shooting star negates this bearish view so the next couple of days should be watched closely in case such a bullish reversal occurs. |
| Aggressive traders can consider taking early action should a decline occur, with a possible play to two possible immediate targets as shown, the first being at or near the 20-day EMA (currently $32.93) which is also near the midpoint of a previous large candlestick. The second being the top of the channel (around $31.60) which may represent former resistance turning into future support. In this way if a classic triple top fails to materialize, and results in an early failure, you can still play the move down to possible early failure. Should the stock eventually weaken below that trough line with an expansion in volume, then the triple top is confirming and a short position could be taken with a suitable protective stop-loss. If the pattern then fulfills to completion it could drop another $7 (distance from triple top to trough 36-29=7). This latter play would be more suitable to the more prudent trader as it has a better risk/reward ratio. However the previous sideways channel should be a major area of support, so a move below there would need a lot of bearish momentum. |
Independent Canadian equities trader and technical analyst based in Peterborough
Ontario, Canada.
| Website: | www.whatsonsale.ca/financial.html |
| E-mail address: | gwg7@sympatico.ca |
Click here for more information about our publications!
PRINT THIS ARTICLE

Request Information From Our Sponsors
- StockCharts.com, Inc.
- Candle Patterns
- Candlestick Charting Explained
- Intermarket Technical Analysis
- John Murphy on Chart Analysis
- John Murphy's Chart Pattern Recognition
- John Murphy's Market Message
- MurphyExplainsMarketAnalysis-Intermarket Analysis
- MurphyExplainsMarketAnalysis-Visual Analysis
- StockCharts.com
- Technical Analysis of the Financial Markets
- The Visual Investor
- VectorVest, Inc.
- Executive Premier Workshop
- One-Day Options Course
- OptionsPro
- Retirement Income Workshop
- Sure-Fire Trading Systems (VectorVest, Inc.)
- Trading as a Business Workshop
- VectorVest 7 EOD
- VectorVest 7 RealTime/IntraDay
- VectorVest AutoTester
- VectorVest Educational Services
- VectorVest OnLine
- VectorVest Options Analyzer
- VectorVest ProGraphics v6.0
- VectorVest ProTrader 7
- VectorVest RealTime Derby Tool
- VectorVest Simulator
- VectorVest Variator
- VectorVest Watchdog