HOT TOPICS LIST
- MACD
- Fibonacci
- RSI
- Gann
- ADXR
- Stochastics
- Volume
- Triangles
- Futures
- Cycles
- Volatility
- ZIGZAG
- MESA
- Retracement
- Aroon
INDICATORS LIST
LIST OF TOPICS
PRINT THIS ARTICLE
by David Penn
Signs of slowing momentum in mid-February lead to a trendline break in mid-March.
Position: N/A
David Penn
Technical Writer for Technical Analysis of STOCKS & COMMODITIES magazine, Working-Money.com, and Traders.com Advantage.
PRINT THIS ARTICLE
REVERSAL
June Crude Breaks Down
03/21/03 10:44:41 AMby David Penn
Signs of slowing momentum in mid-February lead to a trendline break in mid-March.
Position: N/A
| In a recent, Traders.com Advantage piece, "Vouching for Volume" (March 7, 2003), I noted that high volume trendline breaks do not automatically lead to continued movement in the direction of the break. While acknowledging that such breaks are often strong signals that a change in trend is at hand, I emphasized that traders and investors--particularly those looking for shorter-term moves--can be best served by being particularly cautious in the face of such events. In the example of platinum futures in "Vouching for Volume," I pointed out that by using an additional technical set-up--in that case, a 2B test of top--a trader might actually have a surer entry and, hopefully, a more profitable trade. |
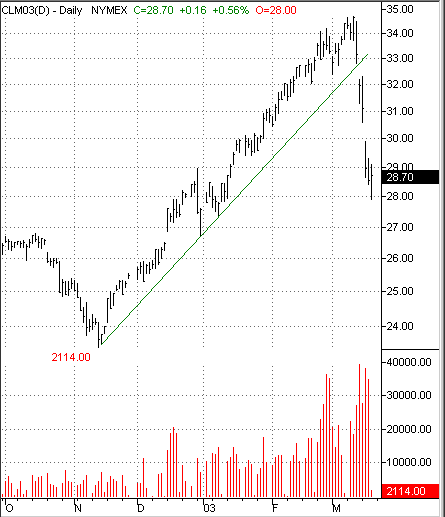
| Another example of using a combination of technical set-ups may have just occurred in crude oil futures. In the case of crude oil, a combination of the "four day corollary" introduced by Victor Sperandeo in his excellent book, Principles of Professional Speculation, and a gap-down trendline break on heavy volume, provided a fairly low risk/high reward opportunity in a volatile market. |

|
| A decisive trendline break on contract high volume was actually the second indication that the uptrend in crude oil was ending. |
| Graphic provided by: TradeStation. |
| |
| The most recent advance in crude oil began early in November, with June crude priced at about 24. By the end of December, June crude was above 27, and by the end of January, June crude was above 30. Moving in to February, June crude continued to move up--experiencing four consecutive up days on the 13th, 14th, 18th and 19th (there was no crude print on Monday, February 17th on Nymex). This, in a trend as mature as crude oil's, is a signal according to Sperandeo's "four day corollary" which suggests that when four consecutive days occur in a mature trend (a relatively subjective interpretation to be sure), the first countertrend day (i.e., four or more consecutive up days followed by a down day) is a signal that the trend may be near an end. In the case of June crude, just such a countertrend day occurred on the 20th of February. |
| The countertrend day in this context suggests that the momentum in the up trend may be shifting. Here, with crude oil moving upward, one way to play the momentum shift would of course be to go short on the day immediately following the countertrend day. Another, potentially less risky approach would be to go short as soon as the market trades below the low of the countertrend day. This would help avoid getting stopped out if the market continues moving in the direction of the trend for a few more days or points before reversing or stalling. The provided chart of June crude shows how the latter approach would have been more fruitful in this particular case. |
| The trendline break on the 14th of March was the second indication of a trend reversal. The fact that the trendline break was also a gap down on contract high volume only underscores the decisiveness of the break. Interestingly, the gap down day would have triggered a sell for the "four day corollary" set-up mentioned above insofar as prices on the gap down day opened just above the low of the countertrend day following the four consecutive up days of the "four day corollary" set-up. From a likely entry point of about 32, June crude fell to a low of 28 before bouncing back just shy of 29. |
Technical Writer for Technical Analysis of STOCKS & COMMODITIES magazine, Working-Money.com, and Traders.com Advantage.
| Title: | Technical Writer |
| Company: | Technical Analysis, Inc. |
| Address: | 4757 California Avenue SW |
| Seattle, WA 98116 | |
| Phone # for sales: | 206 938 0570 |
| Fax: | 206 938 1307 |
| Website: | www.Traders.com |
| E-mail address: | DPenn@traders.com |
Traders' Resource Links | |
| Charting the Stock Market: The Wyckoff Method -- Books | |
| Working-Money.com -- Online Trading Services | |
| Traders.com Advantage -- Online Trading Services | |
| Technical Analysis of Stocks & Commodities -- Publications and Newsletters | |
| Working Money, at Working-Money.com -- Publications and Newsletters | |
| Traders.com Advantage -- Publications and Newsletters | |
| Professional Traders Starter Kit -- Software | |
Click here for more information about our publications!
PRINT THIS ARTICLE

Request Information From Our Sponsors
- StockCharts.com, Inc.
- Candle Patterns
- Candlestick Charting Explained
- Intermarket Technical Analysis
- John Murphy on Chart Analysis
- John Murphy's Chart Pattern Recognition
- John Murphy's Market Message
- MurphyExplainsMarketAnalysis-Intermarket Analysis
- MurphyExplainsMarketAnalysis-Visual Analysis
- StockCharts.com
- Technical Analysis of the Financial Markets
- The Visual Investor
- VectorVest, Inc.
- Executive Premier Workshop
- One-Day Options Course
- OptionsPro
- Retirement Income Workshop
- Sure-Fire Trading Systems (VectorVest, Inc.)
- Trading as a Business Workshop
- VectorVest 7 EOD
- VectorVest 7 RealTime/IntraDay
- VectorVest AutoTester
- VectorVest Educational Services
- VectorVest OnLine
- VectorVest Options Analyzer
- VectorVest ProGraphics v6.0
- VectorVest ProTrader 7
- VectorVest RealTime Derby Tool
- VectorVest Simulator
- VectorVest Variator
- VectorVest Watchdog
