HOT TOPICS LIST
- MACD
- Fibonacci
- RSI
- Gann
- ADXR
- Stochastics
- Volume
- Triangles
- Futures
- Cycles
- Volatility
- ZIGZAG
- MESA
- Retracement
- Aroon
INDICATORS LIST
LIST OF TOPICS
PRINT THIS ARTICLE
by Koos van der Merwe
August Technology Corp. (AUGT) designs, manufactures, markets and services automated visual inspection equipment for the detection of micro-defects. For the fiscal year ended 12/31/02, revenues fell 16% to $25.1 million and their net loss totaled $8.9 million, up from $351 thousand. Not a company one would look at that closely, so why has a brokerage firm upgraded it to a strong buy?
Position: Sell
Koos van der Merwe
Has been a technical analyst since 1969, and has worked as a futures and options trader with First Financial Futures in Johannesburg, South Africa.
PRINT THIS ARTICLE
CUP WITH HANDLE
August Technology Corporation
03/24/03 01:50:44 PMby Koos van der Merwe
August Technology Corp. (AUGT) designs, manufactures, markets and services automated visual inspection equipment for the detection of micro-defects. For the fiscal year ended 12/31/02, revenues fell 16% to $25.1 million and their net loss totaled $8.9 million, up from $351 thousand. Not a company one would look at that closely, so why has a brokerage firm upgraded it to a strong buy?
Position: Sell
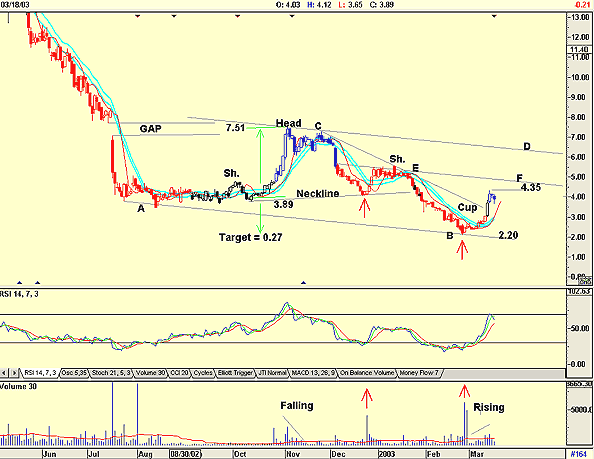
| A look at August Technology's chart below tells me the following: August Technology fell with a gap in July 2002 and then spent the next four months, till November, building up a consolidation strength and rising to fill that gap at $7.51 after reaching a low of $3.46 in August 2002. At the same time, it created a "head' in what appears to be a head and shoulders pattern, forming the right shoulder in January 2003. The calculation from the head to the neckline, 3.62 (7.51 - 3.89), gives a target of: 0.27 (3.89 - 3.62), a sign that you should stay clear of this stock. |
| The long-term support line, AB, drawn as a parallel to the resistance line CD, does show support which the share actually found at "B'" and on an oversold RSI indicator-- nothing that shouts out, "Hey - buy me!" But then, when you look at the volume, a different picture forms. Every time the price falls, it falls on falling volume, a sign of strength. Secondly, after the price reaches a certain "low" level, it suddenly rises (see red arrows) and on very strong volume. Soon after volume falls once again to below average, almost as if to say, "Thanks, I have my fill, and I am prepared to wait long-term." |

|
| August Technology |
| Graphic provided by: AdvancedGET. |
| |
| At the moment, the price is falling once more and on falling volume after having risen very strongly on rising volume from $2.20 on the 26th of February, 2003 to $4.43 on March 14th. This retracement could be forming the handle of a cup and handle pattern as shown. This suggests that any movement above $4.35 would be a buy. |
| The upper target, should this occur, would be $4.35 - $2.20 = $2.15 + $4.35 = $6.50, which is close enough to the resistance line CD to be feasible. |
| My risk reward profile is as follows: Buying at $4.35 and using a 10% stop-loss signal gives me a stop-loss at $3.92, and a loss of $0.42 (4.35-3.92). The calculated target is $6.50, with a profit of $2.15. This is greater than the 2.5:1 profit loss ratio I require (0.42 x 2.5 = 1.05). |
Has been a technical analyst since 1969, and has worked as a futures and options trader with First Financial Futures in Johannesburg, South Africa.
| Address: | 3256 West 24th Ave |
| Vancouver, BC | |
| Phone # for sales: | 6042634214 |
| E-mail address: | petroosp@gmail.com |
Click here for more information about our publications!
PRINT THIS ARTICLE

Request Information From Our Sponsors
- StockCharts.com, Inc.
- Candle Patterns
- Candlestick Charting Explained
- Intermarket Technical Analysis
- John Murphy on Chart Analysis
- John Murphy's Chart Pattern Recognition
- John Murphy's Market Message
- MurphyExplainsMarketAnalysis-Intermarket Analysis
- MurphyExplainsMarketAnalysis-Visual Analysis
- StockCharts.com
- Technical Analysis of the Financial Markets
- The Visual Investor
- VectorVest, Inc.
- Executive Premier Workshop
- One-Day Options Course
- OptionsPro
- Retirement Income Workshop
- Sure-Fire Trading Systems (VectorVest, Inc.)
- Trading as a Business Workshop
- VectorVest 7 EOD
- VectorVest 7 RealTime/IntraDay
- VectorVest AutoTester
- VectorVest Educational Services
- VectorVest OnLine
- VectorVest Options Analyzer
- VectorVest ProGraphics v6.0
- VectorVest ProTrader 7
- VectorVest RealTime Derby Tool
- VectorVest Simulator
- VectorVest Variator
- VectorVest Watchdog
