HOT TOPICS LIST
- MACD
- Fibonacci
- RSI
- Gann
- ADXR
- Stochastics
- Volume
- Triangles
- Futures
- Cycles
- Volatility
- ZIGZAG
- MESA
- Retracement
- Aroon
INDICATORS LIST
LIST OF TOPICS
PRINT THIS ARTICLE
by Kevin Hopson
The AMEX Oil Index (XOI) looks to be in the fifth and final wave of its long-term downtrend. If so, a significant bottom reversal could occur in the coming weeks or months.
Position: Hold
Kevin Hopson
Kevin has been a technical analyst for roughly 10 years now. Previously, Kevin owned his own business and acted as a registered investment advisor, specializing in energy. He was also a freelance oil analyst for Orient Trading Co., a commodity futures trading firm in Japan. Kevin is currently a freelance writer.
PRINT THIS ARTICLE
ELLIOTT WAVE
AMEX Oil Index -- Fifth Wave in Progress?
03/20/03 01:10:54 PMby Kevin Hopson
The AMEX Oil Index (XOI) looks to be in the fifth and final wave of its long-term downtrend. If so, a significant bottom reversal could occur in the coming weeks or months.
Position: Hold
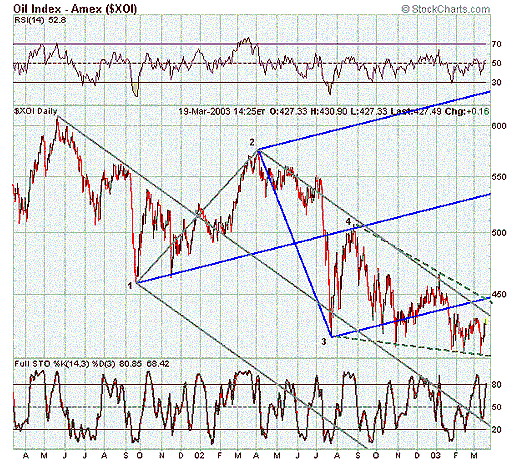
| The AMEX Oil Index (XOI) is a price-weighted index of thirteen large-cap integrated oil companies. Based on the long-term chart, it appears that the XOI is in the fifth and final wave of its two-year downtrend. In other words, the XOI topped out in the spring of 2001, which acted as the beginning of the current downtrend. Since then, the index has made two moves in the direction of the trend (waves 1 and 3) and two corrections against the trend (waves 2 and 4). As you can see, the index resumed its long-term downtrend late last summer, marking the beginning of a potential fifth wave. |
| Two pitchforks have been drawn on the chart to help confirm these waves. For example, the median line of the gray pitchfork is supposed to predict the end of the third wave (or pivot 3). Though the third pivot point slightly breached the gray median line, it was close enough to confirm a significant turning point. Meanwhile, the median line of the blue pitchfork is supposed to predict the end of the fourth wave (or pivot 4). Notice how accurate this was, as prices reversed right at the blue median line. Given the median line analysis, there is a high probability that the XOI is now in the final leg of its downtrend. |

|
| Graphic provided by: StockCharts.com. |
| |
| Another pattern that helps confirm this theory is the declining wedge, as indicated by the dotted green lines. This is basically a triangle formation that slants downward, or a pattern of lower highs and lower lows. Triangle formations often develop during the final stages of a trend. Additionally, wedges usually resolve themselves by a reversal in the opposite direction. Since the wedge is falling, there is a good chance that the formation will eventually be resolved by a break to the upside. When this occurs, it will be an ideal time to get into integrated oil stocks. I will provide an update if and when this scenario plays out. In the meantime, the XOI faces stiff resistance in the 430 to 450 range, site of last April's downtrend line and the top of the declining wedge. |
Kevin has been a technical analyst for roughly 10 years now. Previously, Kevin owned his own business and acted as a registered investment advisor, specializing in energy. He was also a freelance oil analyst for Orient Trading Co., a commodity futures trading firm in Japan. Kevin is currently a freelance writer.
| Glen Allen, VA | |
| E-mail address: | hopson_1@yahoo.com |
Click here for more information about our publications!
Comments

Request Information From Our Sponsors
- StockCharts.com, Inc.
- Candle Patterns
- Candlestick Charting Explained
- Intermarket Technical Analysis
- John Murphy on Chart Analysis
- John Murphy's Chart Pattern Recognition
- John Murphy's Market Message
- MurphyExplainsMarketAnalysis-Intermarket Analysis
- MurphyExplainsMarketAnalysis-Visual Analysis
- StockCharts.com
- Technical Analysis of the Financial Markets
- The Visual Investor
- VectorVest, Inc.
- Executive Premier Workshop
- One-Day Options Course
- OptionsPro
- Retirement Income Workshop
- Sure-Fire Trading Systems (VectorVest, Inc.)
- Trading as a Business Workshop
- VectorVest 7 EOD
- VectorVest 7 RealTime/IntraDay
- VectorVest AutoTester
- VectorVest Educational Services
- VectorVest OnLine
- VectorVest Options Analyzer
- VectorVest ProGraphics v6.0
- VectorVest ProTrader 7
- VectorVest RealTime Derby Tool
- VectorVest Simulator
- VectorVest Variator
- VectorVest Watchdog
