HOT TOPICS LIST
- MACD
- Fibonacci
- RSI
- Gann
- ADXR
- Stochastics
- Volume
- Triangles
- Futures
- Cycles
- Volatility
- ZIGZAG
- MESA
- Retracement
- Aroon
INDICATORS LIST
LIST OF TOPICS
PRINT THIS ARTICLE
by Kevin Hopson
ConocoPhillips (COP) had been stuck in the $46.00 to $50.00 range dating back to October 2002. However, the stock broke out of its four-month trading range late last month, indicating the potential for higher prices in the long-term.
Position: Accumulate
Kevin Hopson
Kevin has been a technical analyst for roughly 10 years now. Previously, Kevin owned his own business and acted as a registered investment advisor, specializing in energy. He was also a freelance oil analyst for Orient Trading Co., a commodity futures trading firm in Japan. Kevin is currently a freelance writer.
PRINT THIS ARTICLE
TECHNICAL ANALYSIS
Recent Channel Breakout for ConocoPhillips
03/21/03 07:52:37 AMby Kevin Hopson
ConocoPhillips (COP) had been stuck in the $46.00 to $50.00 range dating back to October 2002. However, the stock broke out of its four-month trading range late last month, indicating the potential for higher prices in the long-term.
Position: Accumulate
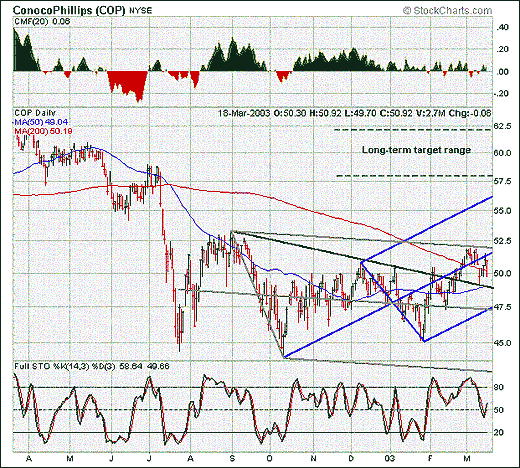
| ConocoPhillips (COP) is an integrated energy company with operations in 49 countries. The company's activities include oil exploration and production (E&P), natural gas gathering, oil refining, marketing and transportation. Technically speaking, the stock had been stuck in the $46.00 to $50.00 range from October 2002 to February 2003. More specifically, the stock formed a four-month trading range. |
| However, as you can see in the chart, ConocoPhillips took out key resistance at the $50.00 level late last month, effectively breaking out of its trading range. Additionally, ConocoPhillips moved above last September's downtrend line (black line) in the process, which was extremely bullish. As a result, the stock should see additional gains in the future, as the channel breakout indicates a potential long-term price target of $58.00 to $62.00. |

|
| Graphic provided by: StockCharts.com. |
| |
| In the short-term, the stock faces significant overhead in the $51.50 to $52.00 range. This is site of the blue median line and top parallel line of the gray pitchfork. Notice how prices have been contained within the gray pitchfork since September of last year. This is significant because a break of resistance along the top parallel line could lead to a substantial breakout. Obviously, this will have to occur at some point in the future if the stock is going to reach its long-term price target. |
| As a result, I believe there will eventually be a break of resistance here. In the meantime, the stock should find near-term support in the $49.00 to $50.00 range, site of its former downtrend line and its 50- and 200-day moving averages. Ultimate support, in the event of a more significant pullback, will likely be the $47.50 level. This is site of January's uptrend line (bottom blue parallel line) and the gray median line. |
Kevin has been a technical analyst for roughly 10 years now. Previously, Kevin owned his own business and acted as a registered investment advisor, specializing in energy. He was also a freelance oil analyst for Orient Trading Co., a commodity futures trading firm in Japan. Kevin is currently a freelance writer.
| Glen Allen, VA | |
| E-mail address: | hopson_1@yahoo.com |
Click here for more information about our publications!
PRINT THIS ARTICLE

Request Information From Our Sponsors
- StockCharts.com, Inc.
- Candle Patterns
- Candlestick Charting Explained
- Intermarket Technical Analysis
- John Murphy on Chart Analysis
- John Murphy's Chart Pattern Recognition
- John Murphy's Market Message
- MurphyExplainsMarketAnalysis-Intermarket Analysis
- MurphyExplainsMarketAnalysis-Visual Analysis
- StockCharts.com
- Technical Analysis of the Financial Markets
- The Visual Investor
- VectorVest, Inc.
- Executive Premier Workshop
- One-Day Options Course
- OptionsPro
- Retirement Income Workshop
- Sure-Fire Trading Systems (VectorVest, Inc.)
- Trading as a Business Workshop
- VectorVest 7 EOD
- VectorVest 7 RealTime/IntraDay
- VectorVest AutoTester
- VectorVest Educational Services
- VectorVest OnLine
- VectorVest Options Analyzer
- VectorVest ProGraphics v6.0
- VectorVest ProTrader 7
- VectorVest RealTime Derby Tool
- VectorVest Simulator
- VectorVest Variator
- VectorVest Watchdog
