

HOT TOPICS LIST
- MACD
- Fibonacci
- RSI
- Gann
- ADXR
- Stochastics
- Volume
- Triangles
- Futures
- Cycles
- Volatility
- ZIGZAG
- MESA
- Retracement
- Aroon
INDICATORS LIST
LIST OF TOPICS
PRINT THIS ARTICLE
by Koos van der Merwe
A head and shoulders pattern is a well known technical tool. How accurate is this chart pattern? One look at the Dow shows exactly how accurate this pattern can be.
Position: Accumulate
Koos van der Merwe
Has been a technical analyst since 1969, and has worked as a futures and options trader with First Financial Futures in Johannesburg, South Africa.
PRINT THIS ARTICLE
HEAD & SHOULDERS
How Now Uncertain Dow?
03/20/03 02:10:56 PMby Koos van der Merwe
A head and shoulders pattern is a well known technical tool. How accurate is this chart pattern? One look at the Dow shows exactly how accurate this pattern can be.
Position: Accumulate
| The head and shoulders pattern is clearly defined in the chart below. The neckline directly below the high point of the head is at 8232. To determine the target the Dow could fall to, as calculated using the head and shoulder technique, I take the highest point reached by the head and subtract from that value the value at the base of the pattern-- the neckline: 9076.34 - 8232 = 843. Then subtract 843 from 8232 to get 7389, the target. The fact that the Dow actually turned on 7389.08 on March 12th surprised me. I have never, ever seen a head and shoulder pattern this accurate. |
| Okay, so where will the Dow go now? With the US probably at war in Iraq by the time this article is published, where can we expect to see the Dow move to in the days and weeks ahead? To determine this I drew Fibonacci retracement levels from the high of the head at 9076.34 to the low reached on March 12th at 7389.08. This gave me three levels as shown on the chart, 8043.08 (38.5%), 8236.30 (50%) and 8434.55 (61.8%). The Dow can find resistance at any one of these levels. On March 17 it tested and easily broke above the 38.5% retracement level. The strength of this movement is probably caused by short sellers covering their positions, and bottom pickers trying their luck. |
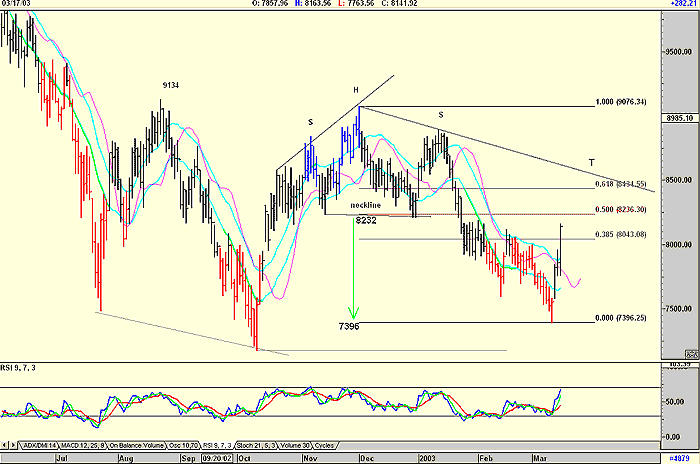
|
| The Dow Jones and a head and shoulder pattern |
| Graphic provided by: AdvancedGET. |
| |
| In the 48 hours given in the ultimatum by the US to Iraq, the Dow could find resistance with a high of the day at the 50% retracement level. It could then fall back and retest either the 38.5% level at 8043.08 which would then become a support level. Or it could fall all the way back to 7389.08 and use this level as a support level. Of course, it could do neither, and trace a completely new pattern. Whatever it does, I have established that any break below 7396.25, the low point formed in October 2002, will see the Dow fall to new lows, and it will be the start of a long-term bear market. |
| The RSI indicator is showing a positive trend, but approaching overbought levels. This is suggesting, especially when you look back at its past performance, that with the uncertainty in the Middle East being resolved, and a definite decision now made, the RSI indicator could be retesting the 32 level, before rising again. This would be consistent with the resistances I expect the Dow to encounter, as mentioned above. |
| Finally, the trendline, HST, is a significant resistance level, and a break above this level will see the start of a major new bull market. As the war starts, the Dow could therefore fall, as shown above, but as it progresses, the Dow is suggesting strength. Markets hate uncertainty, and the certainty now before us is what the Dow has been looking for. |
Has been a technical analyst since 1969, and has worked as a futures and options trader with First Financial Futures in Johannesburg, South Africa.
| Address: | 3256 West 24th Ave |
| Vancouver, BC | |
| Phone # for sales: | 6042634214 |
| E-mail address: | petroosp@gmail.com |
Click here for more information about our publications!
Comments
Date:�03/20/03Rank:�4Comment:�
Date:�03/20/03Rank:�5Comment:�
Date:�03/26/03Rank:�5Comment:�
Date:�03/27/03Rank:�4Comment:�
Date:�04/02/03Rank:�2Comment:�

Request Information From Our Sponsors
- StockCharts.com, Inc.
- Candle Patterns
- Candlestick Charting Explained
- Intermarket Technical Analysis
- John Murphy on Chart Analysis
- John Murphy's Chart Pattern Recognition
- John Murphy's Market Message
- MurphyExplainsMarketAnalysis-Intermarket Analysis
- MurphyExplainsMarketAnalysis-Visual Analysis
- StockCharts.com
- Technical Analysis of the Financial Markets
- The Visual Investor
- VectorVest, Inc.
- Executive Premier Workshop
- One-Day Options Course
- OptionsPro
- Retirement Income Workshop
- Sure-Fire Trading Systems (VectorVest, Inc.)
- Trading as a Business Workshop
- VectorVest 7 EOD
- VectorVest 7 RealTime/IntraDay
- VectorVest AutoTester
- VectorVest Educational Services
- VectorVest OnLine
- VectorVest Options Analyzer
- VectorVest ProGraphics v6.0
- VectorVest ProTrader 7
- VectorVest RealTime Derby Tool
- VectorVest Simulator
- VectorVest Variator
- VectorVest Watchdog