HOT TOPICS LIST
- MACD
- Fibonacci
- RSI
- Gann
- ADXR
- Stochastics
- Volume
- Triangles
- Futures
- Cycles
- Volatility
- ZIGZAG
- MESA
- Retracement
- Aroon
INDICATORS LIST
LIST OF TOPICS
PRINT THIS ARTICLE
by Arthur Hill
Qualcomm (QCOM) may be poised for a bullish move. The stock's chart suggests that a run towards the December 2002 high is likely.
Position: N/A
Arthur Hill
Arthur Hill is currently editor of TDTrader.com, a website specializing in trading strategies, sector/industry specific breadth stats and overall technical analysis. He passed the Society of Technical Analysts (STA London) diploma exam with distinction is a Certified Financial Technician (CFTe). Prior to TD Trader, he was the Chief Technical Analyst for Stockcharts.com and the main contributor to the ChartSchool.
PRINT THIS ARTICLE
CHART ANALYSIS
Qualcomm Signals a Continuation Higher
03/20/03 10:06:29 AMby Arthur Hill
Qualcomm (QCOM) may be poised for a bullish move. The stock's chart suggests that a run towards the December 2002 high is likely.
Position: N/A
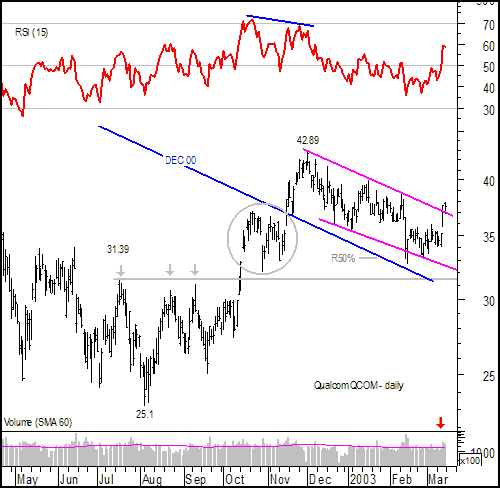
| With the big October-December advance, QCOM broke above the trendline extending down from November 2000 and exceeded key resistance at 31.39. The move was punctuated by gaps and above average volume. With the higher high and subsequent move above 34, the medium-term trend turned bullish. |
| After a 17+ point move in less than three months, the stock became overextended and due for a pullback. RSI reached 71 (overbought) on October 21, and formed a negative divergence in late November. QCOM subsequently retraced 50% of its prior advance (25.1 to 42.89) with a decline back to 32.63. This is a normal retracement for a correction and a logical point to look for support. |

|
| Figure 1: Daily chart for QCOM. |
| Graphic provided by: MetaStock. |
| Graphic provided by: TD Trader.com. |
| |
| In addition to the 50% retracement, resistance levels turn into support zones and securities often return to resistance-turned-support. Resistance levels represent overhanging supply and QCOM made at least three attempts to break 31.39. The final push above 31.39 signaled a victory by demand over supply. Instead of over hanging supply above 31.39, there is now underlying demand that forges a support level. There was also resistance around 34 and this served to create a support zone between 31.39 and 39 (green lines). |
| The decline over the last few week looks like a descending price channel and the upper trendline was touched at least three times, making it a valid trendline. The stock gapped higher on March 13 and finished the day with a strong gain. Volume expanded on the advance and this shows good fuel behind the breakout (red arrow). With the medium-term uptrend already established and a normal correction, the gap and trendline break signal a resumption of the October/December advance. As a continuation move, the advance is projected to exceed the December high over the next few weeks. |
Arthur Hill is currently editor of TDTrader.com, a website specializing in trading strategies, sector/industry specific breadth stats and overall technical analysis. He passed the Society of Technical Analysts (STA London) diploma exam with distinction is a Certified Financial Technician (CFTe). Prior to TD Trader, he was the Chief Technical Analyst for Stockcharts.com and the main contributor to the ChartSchool.
| Title: | Editor |
| Company: | TDTrader.com |
| Address: | Willem Geetsstraat 17 |
| Mechelen, B2800 | |
| Phone # for sales: | 3215345465 |
| Website: | www.tdtrader.com |
| E-mail address: | arthurh@tdtrader.com |
Traders' Resource Links | |
| TDTrader.com has not added any product or service information to TRADERS' RESOURCE. | |
Click here for more information about our publications!
Comments
Date: 03/20/03Rank: 5Comment:

|

Request Information From Our Sponsors
- StockCharts.com, Inc.
- Candle Patterns
- Candlestick Charting Explained
- Intermarket Technical Analysis
- John Murphy on Chart Analysis
- John Murphy's Chart Pattern Recognition
- John Murphy's Market Message
- MurphyExplainsMarketAnalysis-Intermarket Analysis
- MurphyExplainsMarketAnalysis-Visual Analysis
- StockCharts.com
- Technical Analysis of the Financial Markets
- The Visual Investor
- VectorVest, Inc.
- Executive Premier Workshop
- One-Day Options Course
- OptionsPro
- Retirement Income Workshop
- Sure-Fire Trading Systems (VectorVest, Inc.)
- Trading as a Business Workshop
- VectorVest 7 EOD
- VectorVest 7 RealTime/IntraDay
- VectorVest AutoTester
- VectorVest Educational Services
- VectorVest OnLine
- VectorVest Options Analyzer
- VectorVest ProGraphics v6.0
- VectorVest ProTrader 7
- VectorVest RealTime Derby Tool
- VectorVest Simulator
- VectorVest Variator
- VectorVest Watchdog
