HOT TOPICS LIST
- MACD
- Fibonacci
- RSI
- Gann
- ADXR
- Stochastics
- Volume
- Triangles
- Futures
- Cycles
- Volatility
- ZIGZAG
- MESA
- Retracement
- Aroon
INDICATORS LIST
LIST OF TOPICS
PRINT THIS ARTICLE
by Gary Grosschadl
Just as the price of gold falters, the gold index and gold stocks bounce to confuse traders.
Position: N/A
Gary Grosschadl
Independent Canadian equities trader and technical analyst based in Peterborough
Ontario, Canada.
PRINT THIS ARTICLE
XAU Gold Index Bounces Off Support
03/18/03 12:04:48 PMby Gary Grosschadl
Just as the price of gold falters, the gold index and gold stocks bounce to confuse traders.
Position: N/A
| Last week the price of gold collapsed from the $350 area to $332 but before that low was hit, the gold index was already bouncing off support. Late last week (Thursday, March 13) gold fell $12 in one day, yet gold stocks were rising. It seems that when a powerful pattern fulfills on the chart and the move is oversold, it doesn't matter what the gold price does in the very short term. I think more than a few gold traders were left scratching their heads that day. |
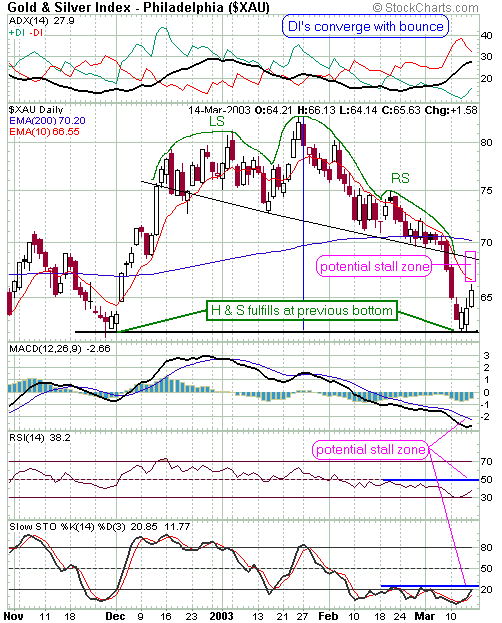
| The daily chart below shows a slanted head and shoulders pattern. An interesting observation here is that when measured from a vertical line below the head, the pattern fulfills exactly at the support line. Normally you measure from the point of neckline failure to get the downside target. When the neckline is fairly horizontal this measure is very straightforward but when it is fairly slanted as in this case, you may want to check different measures such as this vertical method. In this case the vertical method hits the target bang on while the more traditional measure misses by three points (pattern should fulfill three points lower than this bounce level). |

|
| Graphic provided by: StockCharts.com. |
| |
| The chart shows a potential stall zone ahead between the 10-day EMA and the neckline. Just above that is the 200-day EMA, another resistance level to watch. The displayed indicators also show potential stall zones as marked. I am a little skeptical that the first attempt back to the neckline will meet with success because of the speed of this move and because the price of gold is under $350. However the concerns over war with Iraq mean that anything is possible. |
| Interestingly, if you paid no attention to the geopolitical events the past few weeks and just traded the gold stocks on the basis of their charts and this XAU index, you would have done just fine if you recognized the slanted head and shoulders pattern and then waited for a reversal near the combination of the previous low and measured pattern fulfillment. It's with examples like this that technicians often say you only need to study the chart patterns themselves and ignore all the market noise that mostly serves to confuse market watchers. |
Independent Canadian equities trader and technical analyst based in Peterborough
Ontario, Canada.
| Website: | www.whatsonsale.ca/financial.html |
| E-mail address: | gwg7@sympatico.ca |
Click here for more information about our publications!
Comments
Date: 03/18/03Rank: 4Comment:

Request Information From Our Sponsors
- StockCharts.com, Inc.
- Candle Patterns
- Candlestick Charting Explained
- Intermarket Technical Analysis
- John Murphy on Chart Analysis
- John Murphy's Chart Pattern Recognition
- John Murphy's Market Message
- MurphyExplainsMarketAnalysis-Intermarket Analysis
- MurphyExplainsMarketAnalysis-Visual Analysis
- StockCharts.com
- Technical Analysis of the Financial Markets
- The Visual Investor
- VectorVest, Inc.
- Executive Premier Workshop
- One-Day Options Course
- OptionsPro
- Retirement Income Workshop
- Sure-Fire Trading Systems (VectorVest, Inc.)
- Trading as a Business Workshop
- VectorVest 7 EOD
- VectorVest 7 RealTime/IntraDay
- VectorVest AutoTester
- VectorVest Educational Services
- VectorVest OnLine
- VectorVest Options Analyzer
- VectorVest ProGraphics v6.0
- VectorVest ProTrader 7
- VectorVest RealTime Derby Tool
- VectorVest Simulator
- VectorVest Variator
- VectorVest Watchdog
