HOT TOPICS LIST
- MACD
- Fibonacci
- RSI
- Gann
- ADXR
- Stochastics
- Volume
- Triangles
- Futures
- Cycles
- Volatility
- ZIGZAG
- MESA
- Retracement
- Aroon
INDICATORS LIST
LIST OF TOPICS
PRINT THIS ARTICLE
by Gary Grosschadl
Nvidia's (NVDA) colorful advance has lots of overhead resistance to beat as it approaches a trendline test.
Position: N/A
Gary Grosschadl
Independent Canadian equities trader and technical analyst based in Peterborough
Ontario, Canada.
PRINT THIS ARTICLE
CHART ANALYSIS
Nvidia Corporation's Triple Resistance Threat
03/17/03 11:37:56 AMby Gary Grosschadl
Nvidia's (NVDA) colorful advance has lots of overhead resistance to beat as it approaches a trendline test.
Position: N/A
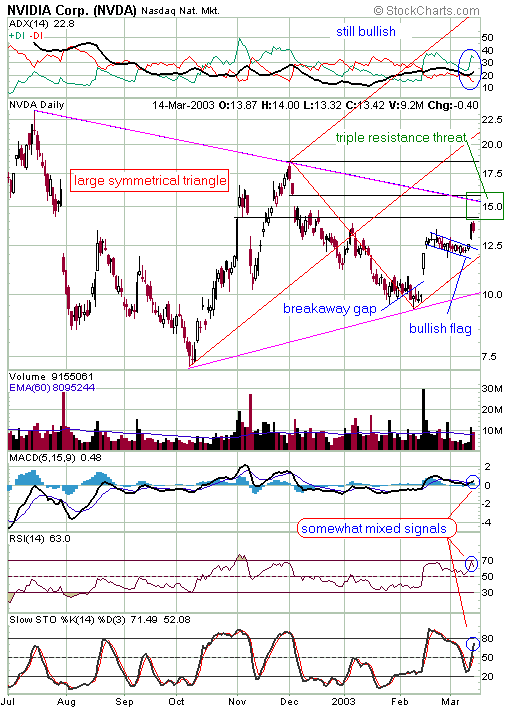
| This daily chart shows a large symmetrical triangle formation, which by nature is a neutral pattern until a decisive break is made outside of its trendlines. As this pattern tightens, it is possible to play any bounce off these trendlines should the move remain contained before an eventual breakout occurs. |
| The advance off the lower trendline has been swift and dramatic via a breakaway gap, followed by a smaller gap, which could be viewed by some traders as a continuation gap. After such an advance, the stock was due for a breather (note the overbought stochastics), and it took the form of a bullish flag formation. After a strong upleg, a narrow channel running counter to the advance is a bullish flag pattern. Another continuation gap drove the stock out of the flag on a large volume spike. Now the advance looks threatened by previous gap resistance. There is a chance that there is enough momentum to thrust higher but the outcome is still up in the air. |

|
| Graphic provided by: StockCharts.com. |
| |
| At any rate, laying directly ahead is a "box" of resistance containing two previous gap resistances and the upper trendline. Traders should be alert for any potential reversal in this area, especially a failure at or near the trendline, especially with stochastics soon to be in oversold territory. |
| The Andrews pitchfork (in red) was drawn into the chart to show the other possible scenario, that being a strong advance past these looming resistance levels, with the ultimate possibility of a bullish triangle breakout. The pitchfork method is just another way of displaying certain support and resistance levels using key pivot points. In a nutshell, pitchfork theory holds that a move off the lower median line has an 80% chance of making a move to the center median line. This implies a big upside potential towards $20. A move that falls short can result in a move back to the lower median line. |
| What this amounts to is a potential move off the upper triangle trendline, should it go that far. It should be a big move either way. A failure move will result in a sizable downside potential and a breakout move can show good upside potential. The prudent play here is for traders to watch for the "elephant tracks" to appear and then go with the trend. A large volume spike should be accompanied with this move to give it added clarity, otherwise it could be a reversal trap either for the bulls or bears as the case may be. Once again, the patient hunter/trader should follow with both barrels loaded for action and wait for the opportune time to strike. |
Independent Canadian equities trader and technical analyst based in Peterborough
Ontario, Canada.
| Website: | www.whatsonsale.ca/financial.html |
| E-mail address: | gwg7@sympatico.ca |
Click here for more information about our publications!
Comments
Date: 03/17/03Rank: 4Comment:

Request Information From Our Sponsors
- StockCharts.com, Inc.
- Candle Patterns
- Candlestick Charting Explained
- Intermarket Technical Analysis
- John Murphy on Chart Analysis
- John Murphy's Chart Pattern Recognition
- John Murphy's Market Message
- MurphyExplainsMarketAnalysis-Intermarket Analysis
- MurphyExplainsMarketAnalysis-Visual Analysis
- StockCharts.com
- Technical Analysis of the Financial Markets
- The Visual Investor
- VectorVest, Inc.
- Executive Premier Workshop
- One-Day Options Course
- OptionsPro
- Retirement Income Workshop
- Sure-Fire Trading Systems (VectorVest, Inc.)
- Trading as a Business Workshop
- VectorVest 7 EOD
- VectorVest 7 RealTime/IntraDay
- VectorVest AutoTester
- VectorVest Educational Services
- VectorVest OnLine
- VectorVest Options Analyzer
- VectorVest ProGraphics v6.0
- VectorVest ProTrader 7
- VectorVest RealTime Derby Tool
- VectorVest Simulator
- VectorVest Variator
- VectorVest Watchdog
