HOT TOPICS LIST
- MACD
- Fibonacci
- RSI
- Gann
- ADXR
- Stochastics
- Volume
- Triangles
- Futures
- Cycles
- Volatility
- ZIGZAG
- MESA
- Retracement
- Aroon
INDICATORS LIST
LIST OF TOPICS
PRINT THIS ARTICLE
by Gary Grosschadl
This Canadian oil field services company has had a small head and shoulders pattern fuflilled and now may test a much bigger pattern.
Position: N/A
Gary Grosschadl
Independent Canadian equities trader and technical analyst based in Peterborough
Ontario, Canada.
PRINT THIS ARTICLE
HEAD & SHOULDERS
Precision Drilling's Double Head & Shoulders Pattern
03/18/03 12:06:23 PMby Gary Grosschadl
This Canadian oil field services company has had a small head and shoulders pattern fuflilled and now may test a much bigger pattern.
Position: N/A
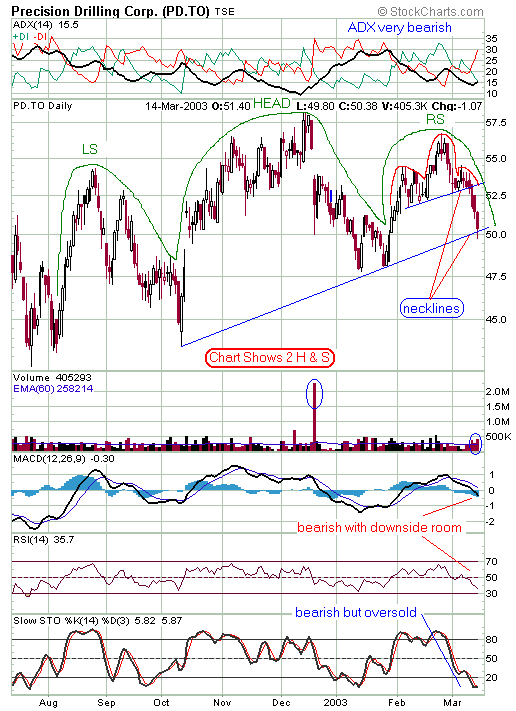
| Precision Drilling's (PD.to) daily chart shows a large head and shoulders topping pattern. Looking carefully in the right shoulder area, I have labelled a smaller head and shoulders pattern that just fulfilled (distance from neckline to head as applied to downside break). Note the higher volume during this decline from right shoulder-- this is consistent with the ideal pattern. |
| The compelling observation here is that this can eventually lead to a much bigger downside move as witnessed by the much larger head and shoulders pattern developing over the duration of this chart. |

|
| Graphic provided by: StockCharts.com. |
| |
| What is likely to occur next is a pause or a brief upleg attempt towards the neckline before the potential bigger downleg occurs. Looking at the oversold stochastics indicator, some kind of bounce can be expected, perhaps shortlived, judging by the negative look of the other displayed indicators. |
| For aggressive traders, a possible play would be to target a short position once the next upmove falters and the stock reverses again to downside, testing the neckline at around $50 again. The more patient and prudent trader can wait for the trendline test and upon a higher volume failure, can then assume a short position. Use a suitable protective stop-loss to guard against any surprise reversals to upside. |
Independent Canadian equities trader and technical analyst based in Peterborough
Ontario, Canada.
| Website: | www.whatsonsale.ca/financial.html |
| E-mail address: | gwg7@sympatico.ca |
Click here for more information about our publications!
Comments
Date: 03/18/03Rank: 4Comment:

Request Information From Our Sponsors
- StockCharts.com, Inc.
- Candle Patterns
- Candlestick Charting Explained
- Intermarket Technical Analysis
- John Murphy on Chart Analysis
- John Murphy's Chart Pattern Recognition
- John Murphy's Market Message
- MurphyExplainsMarketAnalysis-Intermarket Analysis
- MurphyExplainsMarketAnalysis-Visual Analysis
- StockCharts.com
- Technical Analysis of the Financial Markets
- The Visual Investor
- VectorVest, Inc.
- Executive Premier Workshop
- One-Day Options Course
- OptionsPro
- Retirement Income Workshop
- Sure-Fire Trading Systems (VectorVest, Inc.)
- Trading as a Business Workshop
- VectorVest 7 EOD
- VectorVest 7 RealTime/IntraDay
- VectorVest AutoTester
- VectorVest Educational Services
- VectorVest OnLine
- VectorVest Options Analyzer
- VectorVest ProGraphics v6.0
- VectorVest ProTrader 7
- VectorVest RealTime Derby Tool
- VectorVest Simulator
- VectorVest Variator
- VectorVest Watchdog
