

HOT TOPICS LIST
- MACD
- Fibonacci
- RSI
- Gann
- ADXR
- Stochastics
- Volume
- Triangles
- Futures
- Cycles
- Volatility
- ZIGZAG
- MESA
- Retracement
- Aroon
INDICATORS LIST
LIST OF TOPICS
PRINT THIS ARTICLE
by Gary Grosschadl
The Nasdaq is the farthest along in the race to test the powerful 200-day EMA overhead resistance. What happens here may determine the fate of the other main indices.
Position: N/A
Gary Grosschadl
Independent Canadian equities trader and technical analyst based in Peterborough
Ontario, Canada.
PRINT THIS ARTICLE
The Nasdaq = Canary In The Coal Mine
03/14/03 08:02:08 AMby Gary Grosschadl
The Nasdaq is the farthest along in the race to test the powerful 200-day EMA overhead resistance. What happens here may determine the fate of the other main indices.
Position: N/A
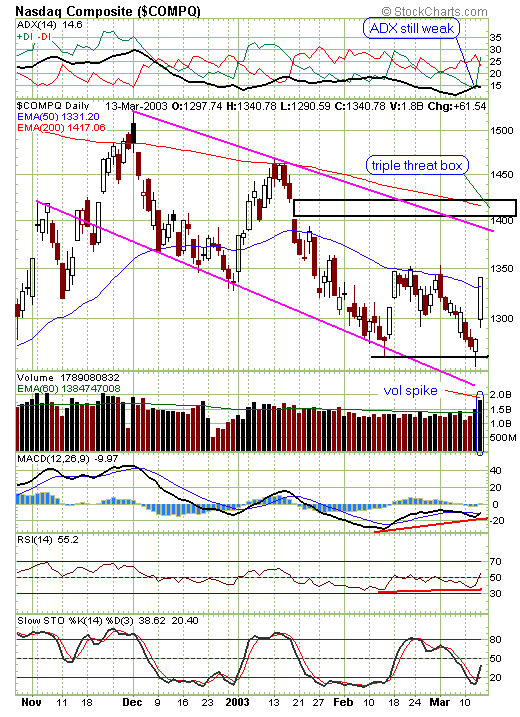
| All the main indices, including European stock indices, have a very important test ahead. This current bullish thrust may lead to an important technical milestone test, that being the closely watched 200-day moving average. I often prefer the exponential moving average (EMA) over the simple moving average (SMA) as it is weighted more towards recent action. These MAs are often very close but with extra volatility, can be significantly apart. In this case the 200-day SMA is at 1352 while the 200-day EMA resides at 1417. As this chart shows, the last bullish upleg halted exactly at the 200-day EMA (not the SMA which was at a lower threshold). |
| What's more, the 200-day EMA also lies in a "triple threat box" which makes this resistance level extra meaningful. This box represents an important Fibonacci retracement level -- a 61.8% retracement from the lowest point on the chart towards the highest point (1520) and also relates to a previous gap area. Previous gaps often act as important support or resistance areas. It should also be noted that a parallel channel trendline lies just below this box and could represent an area of early failure or stall point. Success here can also be a harbinger of the trend to finally change with the next test being just ahead. |
|
| Graphic provided by: StockCharts.com. |
| |
| Several indicators are also worth mentioning. The directional movement indicator at the top of the chart shows a sudden bullish DI crossover but the ADX line is still fairly weak. For this upleg to have running room, the ADX line will have to rise above 20 which normally indicates some power to a building trend, something it failed to do the last time it ran up. The MACD (moving average convergence/divergence) indicator shows positive divergence to price action and a crossover just starting. It should also rise past the zero line to avoid any early stall. The RSI (relative strength index) shows a smaller divergence and also shows a move past its 50 level, which is bullish. Stochastics show a move up from oversold levels and will have to be watched closely for any reversal at or past the 80 level. This often signals the start of a downleg. |
| It is a safe bet that the Nasdaq will be the first major index to test the 200-day EMA and the result there can speak volumes. Since this will be the third attempt for these indices to beat this threshold, the outcome can have a stronger significance. Technical analysis often has extra importance at third attempts at support and resistance levels. Success or failure here can be very telling in the longer term and may finally turn the trend away from the bears and give the bulls a badly needed boost. |
Independent Canadian equities trader and technical analyst based in Peterborough
Ontario, Canada.
| Website: | www.whatsonsale.ca/financial.html |
| E-mail address: | gwg7@sympatico.ca |
Click here for more information about our publications!
Comments
Date:�03/15/03Rank:�5Comment:�
Date:�03/17/03Rank:�4Comment:�

Request Information From Our Sponsors
- StockCharts.com, Inc.
- Candle Patterns
- Candlestick Charting Explained
- Intermarket Technical Analysis
- John Murphy on Chart Analysis
- John Murphy's Chart Pattern Recognition
- John Murphy's Market Message
- MurphyExplainsMarketAnalysis-Intermarket Analysis
- MurphyExplainsMarketAnalysis-Visual Analysis
- StockCharts.com
- Technical Analysis of the Financial Markets
- The Visual Investor
- VectorVest, Inc.
- Executive Premier Workshop
- One-Day Options Course
- OptionsPro
- Retirement Income Workshop
- Sure-Fire Trading Systems (VectorVest, Inc.)
- Trading as a Business Workshop
- VectorVest 7 EOD
- VectorVest 7 RealTime/IntraDay
- VectorVest AutoTester
- VectorVest Educational Services
- VectorVest OnLine
- VectorVest Options Analyzer
- VectorVest ProGraphics v6.0
- VectorVest ProTrader 7
- VectorVest RealTime Derby Tool
- VectorVest Simulator
- VectorVest Variator
- VectorVest Watchdog