HOT TOPICS LIST
- MACD
- Fibonacci
- RSI
- Gann
- ADXR
- Stochastics
- Volume
- Triangles
- Futures
- Cycles
- Volatility
- ZIGZAG
- MESA
- Retracement
- Aroon
INDICATORS LIST
LIST OF TOPICS
PRINT THIS ARTICLE
by David Penn
After failing to take out the October highs, cocoa looks poised to test the November lows.
Position: N/A
David Penn
Technical Writer for Technical Analysis of STOCKS & COMMODITIES magazine, Working-Money.com, and Traders.com Advantage.
PRINT THIS ARTICLE
DESCENDING TRIANGLES
Cocoa's Descending Triangle
03/14/03 09:42:42 AMby David Penn
After failing to take out the October highs, cocoa looks poised to test the November lows.
Position: N/A
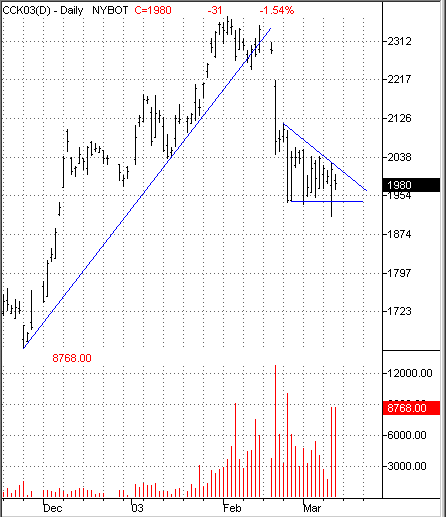
| Cocoa futures--basis May--decisively broke through a two-month up trendline in February. The break was on contract-high volume, which signified a great deal of conviction on the part of the sellers. As I suggested in a recent piece ("Vouching for Volume," Traders.com Advantage, March 7, 2003), high-volume trendline breaks are important signals, but reading them accurately--as opposed to following them blindly--is key. In the example of platinum futures used in "Vouching for Volume," a short entry taken immediately after the high-volume trendline break to the downside would quite possibly have been stopped out as platinum reversed and proceeded to make a new contract high. |
| Here, a trader pursuing the high-volume breakdown in cocoa futures would not be as penalized. After dropping almost 130 points to a close of 2072 on the breakdown day, cocoa futures did in fact continue lower. But their descent has been stalled by the development of support at approximately 1950. This support level has held up for more than thirteen days. So while a short position following the high-volume breakdown would not have experienced signficant losses and would, in fact, still be a profitable position, cocoa remains stubbornly resistant to resuming its decline. |

|
| This descending triangle could anticipate a significant drop in cocoa prices. |
| Graphic provided by: TradeStation. |
| |
| This stubbornness has taken the form of a descending triangle--or so it appears at this point (again, basis May). In addition to the horizontal support line at 1950, there is a diagonal resistance line that extends from the highs of February 24th at 2115 to the highs of March 12th at 2025. The descending triangle is a bearish formation, and can appear both as a top as well as a continuation or consolidation formation in a downtrend that has already developed. In this case, of course, the triangle is appearing as part of the downtrend that began when the most recent cocoa rally topped out in late January. |
| What sort of downside might be expected from a break in support in May cocoa? Assuming a downside break, the formation size of the descending triangle is 165 points which, when subtracted from the value at the support level (again, approximately 1950), gives a minimum downside target of 1785. While a move to this level would not in and of itself represent a test of the November lows (which stand at 1655), such a downswing would make for an 82% retracement of the advance from the November lows to the highs in late January (a 720 point advance followed by a 590 point decline). From the perspective of a cocoa bull, this suggests that it is quite possible that the entirety of the November to late January advance eventually might be retraced before cocoa prices begin to move upward again in any meaningful way. (Note that at 1950, cocoa has retraced approximately 59% of the previous rally.) |
Technical Writer for Technical Analysis of STOCKS & COMMODITIES magazine, Working-Money.com, and Traders.com Advantage.
| Title: | Technical Writer |
| Company: | Technical Analysis, Inc. |
| Address: | 4757 California Avenue SW |
| Seattle, WA 98116 | |
| Phone # for sales: | 206 938 0570 |
| Fax: | 206 938 1307 |
| Website: | www.Traders.com |
| E-mail address: | DPenn@traders.com |
Traders' Resource Links | |
| Charting the Stock Market: The Wyckoff Method -- Books | |
| Working-Money.com -- Online Trading Services | |
| Traders.com Advantage -- Online Trading Services | |
| Technical Analysis of Stocks & Commodities -- Publications and Newsletters | |
| Working Money, at Working-Money.com -- Publications and Newsletters | |
| Traders.com Advantage -- Publications and Newsletters | |
| Professional Traders Starter Kit -- Software | |
Click here for more information about our publications!
Comments

|

Request Information From Our Sponsors
- StockCharts.com, Inc.
- Candle Patterns
- Candlestick Charting Explained
- Intermarket Technical Analysis
- John Murphy on Chart Analysis
- John Murphy's Chart Pattern Recognition
- John Murphy's Market Message
- MurphyExplainsMarketAnalysis-Intermarket Analysis
- MurphyExplainsMarketAnalysis-Visual Analysis
- StockCharts.com
- Technical Analysis of the Financial Markets
- The Visual Investor
- VectorVest, Inc.
- Executive Premier Workshop
- One-Day Options Course
- OptionsPro
- Retirement Income Workshop
- Sure-Fire Trading Systems (VectorVest, Inc.)
- Trading as a Business Workshop
- VectorVest 7 EOD
- VectorVest 7 RealTime/IntraDay
- VectorVest AutoTester
- VectorVest Educational Services
- VectorVest OnLine
- VectorVest Options Analyzer
- VectorVest ProGraphics v6.0
- VectorVest ProTrader 7
- VectorVest RealTime Derby Tool
- VectorVest Simulator
- VectorVest Variator
- VectorVest Watchdog
