HOT TOPICS LIST
- MACD
- Fibonacci
- RSI
- Gann
- ADXR
- Stochastics
- Volume
- Triangles
- Futures
- Cycles
- Volatility
- ZIGZAG
- MESA
- Retracement
- Aroon
INDICATORS LIST
LIST OF TOPICS
PRINT THIS ARTICLE
by Koos van der Merwe
Xerox is another stock that can be added to my "would like to own" stocks as the market falls in anticipation of a war in Iraq. Stocks on the list are those I believe can be purchased at bargain prices in an uncertain market, and should be held for the long to medium term. I have included Xerox because. . .
Position: Accumulate
Koos van der Merwe
Has been a technical analyst since 1969, and has worked as a futures and options trader with First Financial Futures in Johannesburg, South Africa.
PRINT THIS ARTICLE
TRIANGLES
Xerox, Another for the List
03/13/03 01:51:17 PMby Koos van der Merwe
Xerox is another stock that can be added to my "would like to own" stocks as the market falls in anticipation of a war in Iraq. Stocks on the list are those I believe can be purchased at bargain prices in an uncertain market, and should be held for the long to medium term. I have included Xerox because. . .
Position: Accumulate
| Xerox (XRX) has had many problems over the past few years, from Enronitis to bad corporate decision making. They attempted to compete with young upstart Japanese and Korean companies who developed and manufactured consumer friendly products in a cheaper price range. Xerox should have stuck to what they know best. They have an excellent research department, which under the guidance of CEO Anne MacCauley, will be developed to improve the present mobile workforce that is growing in today's world. |
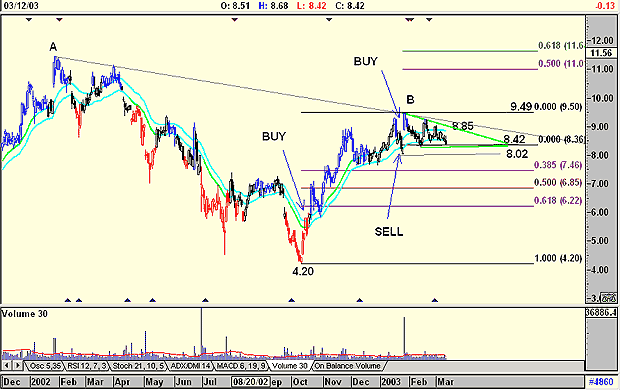
| Xerox has paid the piper for their past accounting indiscretions, and their restructuring and return to a controllable debt position is bearing fruit for the bottom pickers who put their faith in the company's management. The chart below shows this. |

|
| Xerox |
| Graphic provided by: AdvancedGET. |
| |
| On May 31st, 1999, the share price reached a high of $63.93 (not shown on the chart). It then fell to a low of $4.20 on the 10th of October, 2002, forming a classic "V" bottom. The price then rose to $9.48 on January 28th, 2003 and since then it appears to be consolidating -- forming what could be a descending right angle triangle. |
| The price gave a JM buy signal at $5.89 on rising volume on October 16th, 2002. (The JM internal band is a 15-day moving average offset by 2% on either side.) From this level, the price rose strongly, eventually giving a JM sell signal at $8.19 on January 24th, 2003. It reversed promptly on exceptionally strong volume, and with a gap reached a high of $9.49. This was a level testing the long-term resistance line AB. Since then it has been consolidating, forming a descending right angle triangle with a base at $8.42. |
| Should the price break below $8.42, it would find resistance at $8.02. A break below $8.02 could see it test any one of the Fibonacci retracement levels shown on the chart: $7.46 (38.5%), $6.85 (50%), or $6.22 (61.8%). Using my preferred targeting method, the point and figure horizontal count, I arrived at a target of $12.06. Whatever the immediate target, Xerox is a company that is reinventing itself -- learning from its past mistakes, and getting on with it. It is a company worth owning and could be purchased at lower levels once the market bottoms and starts rising after world uncertainty stabilizes. However, should the right angle triangle fail, and the price rise and break above the $8.85 level, then the long-term resistance line and finally the resistance at $9.49, Xerox could rise to $11.64, a 61.8% Fibonacci extension of the distance from $4.20 to $9.49 taken from the low at $8.42. |
Has been a technical analyst since 1969, and has worked as a futures and options trader with First Financial Futures in Johannesburg, South Africa.
| Address: | 3256 West 24th Ave |
| Vancouver, BC | |
| Phone # for sales: | 6042634214 |
| E-mail address: | petroosp@gmail.com |
Click here for more information about our publications!
Comments

|

Request Information From Our Sponsors
- VectorVest, Inc.
- Executive Premier Workshop
- One-Day Options Course
- OptionsPro
- Retirement Income Workshop
- Sure-Fire Trading Systems (VectorVest, Inc.)
- Trading as a Business Workshop
- VectorVest 7 EOD
- VectorVest 7 RealTime/IntraDay
- VectorVest AutoTester
- VectorVest Educational Services
- VectorVest OnLine
- VectorVest Options Analyzer
- VectorVest ProGraphics v6.0
- VectorVest ProTrader 7
- VectorVest RealTime Derby Tool
- VectorVest Simulator
- VectorVest Variator
- VectorVest Watchdog
- StockCharts.com, Inc.
- Candle Patterns
- Candlestick Charting Explained
- Intermarket Technical Analysis
- John Murphy on Chart Analysis
- John Murphy's Chart Pattern Recognition
- John Murphy's Market Message
- MurphyExplainsMarketAnalysis-Intermarket Analysis
- MurphyExplainsMarketAnalysis-Visual Analysis
- StockCharts.com
- Technical Analysis of the Financial Markets
- The Visual Investor
