HOT TOPICS LIST
- MACD
- Fibonacci
- RSI
- Gann
- ADXR
- Stochastics
- Volume
- Triangles
- Futures
- Cycles
- Volatility
- ZIGZAG
- MESA
- Retracement
- Aroon
INDICATORS LIST
LIST OF TOPICS
PRINT THIS ARTICLE
by Gary Grosschadl
While several European markets are failing badly, the British seem to be trying to make a stand via a possible double bottom pattern.
Position: N/A
Gary Grosschadl
Independent Canadian equities trader and technical analyst based in Peterborough
Ontario, Canada.
PRINT THIS ARTICLE
DOUBLE BOTTOMS
Will London Lead Europe Higher?
03/13/03 11:55:14 AMby Gary Grosschadl
While several European markets are failing badly, the British seem to be trying to make a stand via a possible double bottom pattern.
Position: N/A
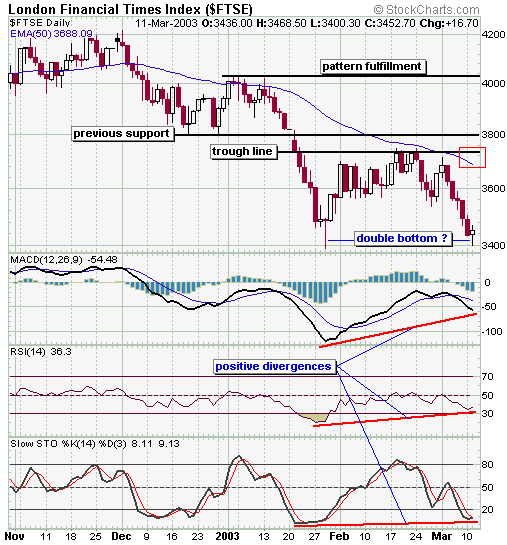
| After five down days in a row, the London Financial Times Index has finally shown an up day which looks like a possible chance at a double bottom attempt. Despite the small upper shadow above the candle body, the lower shadow makes it close enough to a hammer candle signal at this critical juncture, and I will cut it some slack. |
| I always look to see if any indicators show divergences to any potential bottoming or topping formations as added weight. In this case I do see multiple positive divergences to price action from several displayed indicators as shown. As always with bottom hammers or near bottom hammers, confirmation is required, ideally on the next day via a bullish candlestick or up day. |

|
| Graphic provided by: StockCharts.com. |
| |
| Should this double bottom pattern turn out to be valid, it will have to reach the trough line as indicated. Note the 50-period EMA line before the trough line as this also represents a potential stall area. Given these volatile and uncertain times, resistance at 3600 should also be anticipated especially since 20-period EMA resistance (not shown) resides at 3590. |
| Should this index indeed find some upside running power (unlikely but let the chart decide), then the next prevalent resistance areas to watch are 3800 (previous support-turned-resistance) and the pattern fulfillment target (by measurement of trough to bottom, applied above trough) near the 4000 mark. This index has a lot to prove before it hits that mark so one step at a time. |
Independent Canadian equities trader and technical analyst based in Peterborough
Ontario, Canada.
| Website: | www.whatsonsale.ca/financial.html |
| E-mail address: | gwg7@sympatico.ca |
Click here for more information about our publications!
PRINT THIS ARTICLE

Request Information From Our Sponsors
- VectorVest, Inc.
- Executive Premier Workshop
- One-Day Options Course
- OptionsPro
- Retirement Income Workshop
- Sure-Fire Trading Systems (VectorVest, Inc.)
- Trading as a Business Workshop
- VectorVest 7 EOD
- VectorVest 7 RealTime/IntraDay
- VectorVest AutoTester
- VectorVest Educational Services
- VectorVest OnLine
- VectorVest Options Analyzer
- VectorVest ProGraphics v6.0
- VectorVest ProTrader 7
- VectorVest RealTime Derby Tool
- VectorVest Simulator
- VectorVest Variator
- VectorVest Watchdog
- StockCharts.com, Inc.
- Candle Patterns
- Candlestick Charting Explained
- Intermarket Technical Analysis
- John Murphy on Chart Analysis
- John Murphy's Chart Pattern Recognition
- John Murphy's Market Message
- MurphyExplainsMarketAnalysis-Intermarket Analysis
- MurphyExplainsMarketAnalysis-Visual Analysis
- StockCharts.com
- Technical Analysis of the Financial Markets
- The Visual Investor
