HOT TOPICS LIST
- MACD
- Fibonacci
- RSI
- Gann
- ADXR
- Stochastics
- Volume
- Triangles
- Futures
- Cycles
- Volatility
- ZIGZAG
- MESA
- Retracement
- Aroon
INDICATORS LIST
LIST OF TOPICS
PRINT THIS ARTICLE
by Gary Grosschadl
This Canadian forest products company is trying a bounce off trendline support.
Position: Buy
Gary Grosschadl
Independent Canadian equities trader and technical analyst based in Peterborough
Ontario, Canada.
PRINT THIS ARTICLE
CHART ANALYSIS
Canfor Corporation Tries a Bounce
03/13/03 08:58:13 AMby Gary Grosschadl
This Canadian forest products company is trying a bounce off trendline support.
Position: Buy
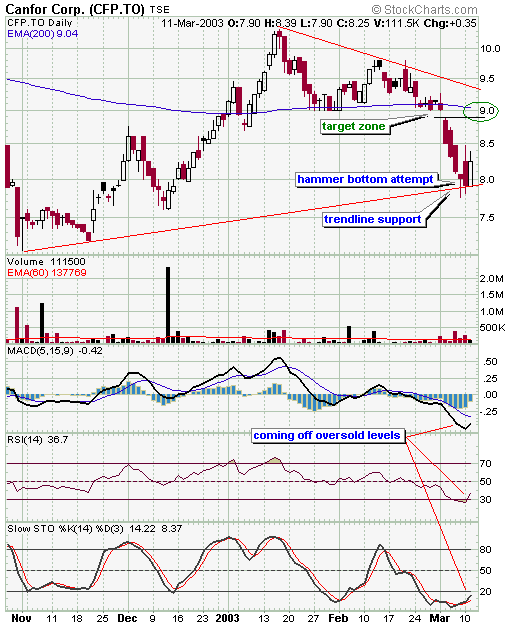
| Canfor Corporation (CFP.to) came down quickly after falling through its 200-day EMA. This also could have been considered a descending triangle failure. Their 5-month chart shows a move down to a lower trendline and a likely bounce via a possible bottom hammer signal. Ideally, volume should have been higher, perhaps resulting in a slower confirmation-- taking longer than one day to confirm. The confirmation came on the second day, with a close above the hammer candlestick. |
| Several indicators add weight to this bullish move. MACD (moving average convergence/divergence), RSI (relative strength index) and stochastics all show a move up from oversold conditions. Ideally these indicators will continue their ascent with bullish price action resulting in the MACD line crossing over its signal line, RSI rising above 50 and stochastics rising above its 20 level. Failure to do this could represent a stalled move...something to watch for and consider. |

|
| Graphic provided by: StockCharts.com. |
| |
| I am showing a target zone encompassing a gap area and 200-day EMA which covers $8.90 - 9.04. Further bullishness could also bring the stock up to test the upper trendline at the $9.35 level. Watch for reversal signs at or near those areas as a guide going forward. Should this move fail very early, an initial stop-loss at $7.99 is prudent and this should be raised as a trailing stop until the market takes you out for a profit, ideally at the target zone or higher. Liquidity is not great and this adds an element of additional risk. |
Independent Canadian equities trader and technical analyst based in Peterborough
Ontario, Canada.
| Website: | www.whatsonsale.ca/financial.html |
| E-mail address: | gwg7@sympatico.ca |
Click here for more information about our publications!
PRINT THIS ARTICLE

|

Request Information From Our Sponsors
- StockCharts.com, Inc.
- Candle Patterns
- Candlestick Charting Explained
- Intermarket Technical Analysis
- John Murphy on Chart Analysis
- John Murphy's Chart Pattern Recognition
- John Murphy's Market Message
- MurphyExplainsMarketAnalysis-Intermarket Analysis
- MurphyExplainsMarketAnalysis-Visual Analysis
- StockCharts.com
- Technical Analysis of the Financial Markets
- The Visual Investor
- VectorVest, Inc.
- Executive Premier Workshop
- One-Day Options Course
- OptionsPro
- Retirement Income Workshop
- Sure-Fire Trading Systems (VectorVest, Inc.)
- Trading as a Business Workshop
- VectorVest 7 EOD
- VectorVest 7 RealTime/IntraDay
- VectorVest AutoTester
- VectorVest Educational Services
- VectorVest OnLine
- VectorVest Options Analyzer
- VectorVest ProGraphics v6.0
- VectorVest ProTrader 7
- VectorVest RealTime Derby Tool
- VectorVest Simulator
- VectorVest Variator
- VectorVest Watchdog
