HOT TOPICS LIST
- MACD
- Fibonacci
- RSI
- Gann
- ADXR
- Stochastics
- Volume
- Triangles
- Futures
- Cycles
- Volatility
- ZIGZAG
- MESA
- Retracement
- Aroon
INDICATORS LIST
LIST OF TOPICS
PRINT THIS ARTICLE
by Gary Grosschadl
Despite the uncertainty over geopolitical concerns, these charts suggest a bounce attempt is likely.
Position: N/A
Gary Grosschadl
Independent Canadian equities trader and technical analyst based in Peterborough
Ontario, Canada.
PRINT THIS ARTICLE
Markets Try to Hammer Out a Short-Term Bottom
03/10/03 01:29:46 PMby Gary Grosschadl
Despite the uncertainty over geopolitical concerns, these charts suggest a bounce attempt is likely.
Position: N/A
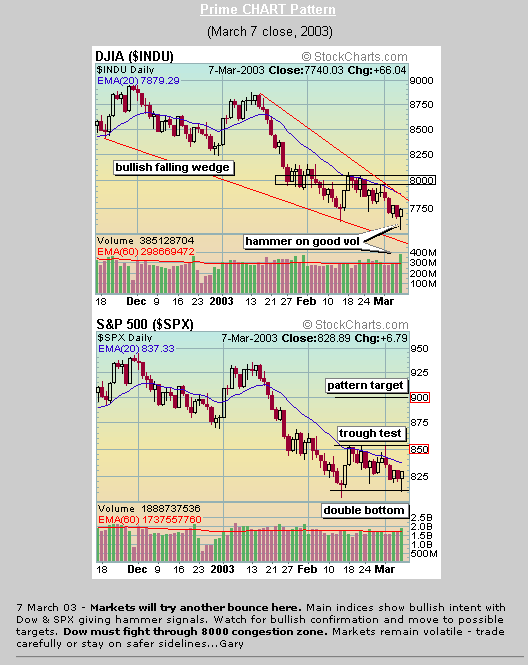
| The main indices are showing bullish intent with the bottom hammers from Friday's action. These bottom hammers are accompanied by higher than average recent volume and this offers additional credence to this bullish view. The hammers do require next day confirmation via a bullish day. How far this technical bounce goes remains to be seen. |
| On the daily Dow chart below, a falling wedge pattern is evident and this is a potentially bullish pattern. Should this bullish upside now be launched off this hammer, there are two immediate resistance targets, the first being the 20-day EMA (exponential moving average) currently at 7879, and the next being the previous congestion area around the 8000 level. A regroup or retracement there would not be a surprise. The next level of upside resistance I see on the chart would be the 8150 - 8250 zone. |

|
| "Prime Chart Pattern" from chartlook.com with permission. |
| Graphic provided by: StockCharts.com. |
| |
| On the S&P 500 chart, a similar move is probable. Unlike the Dow it did not actually go under the recent low but did come very close-- Close enough to argue a possible small double bottom pattern. In this case the pattern is not ideal. It is preferable to see a longer time period between bottoms, better symmetry and lower volume on the second bottom. However the trough line seems to be in line with an obvious resistance level so I will give the pattern some leeway as a smaller double bottom. Not all patterns are ideal. Should this proposed pattern fulfill to completion, the upside target by measurement would be 900. Reversals at or near those suggested resistance targets should be respected. However, failure of hammer being confirmed to upside, negates the bottom hammer and leaves the door open to additional downside. The action of the next few days should be carefully watched for more additional clues such as volume confirmation (weak volume shows poor commitment) and any sudden reversals either way. The markets remain volatile and reversal oriented. |
Independent Canadian equities trader and technical analyst based in Peterborough
Ontario, Canada.
| Website: | www.whatsonsale.ca/financial.html |
| E-mail address: | gwg7@sympatico.ca |
Click here for more information about our publications!
Comments
Date: 03/19/03Rank: 3Comment:

|

Request Information From Our Sponsors
- StockCharts.com, Inc.
- Candle Patterns
- Candlestick Charting Explained
- Intermarket Technical Analysis
- John Murphy on Chart Analysis
- John Murphy's Chart Pattern Recognition
- John Murphy's Market Message
- MurphyExplainsMarketAnalysis-Intermarket Analysis
- MurphyExplainsMarketAnalysis-Visual Analysis
- StockCharts.com
- Technical Analysis of the Financial Markets
- The Visual Investor
- VectorVest, Inc.
- Executive Premier Workshop
- One-Day Options Course
- OptionsPro
- Retirement Income Workshop
- Sure-Fire Trading Systems (VectorVest, Inc.)
- Trading as a Business Workshop
- VectorVest 7 EOD
- VectorVest 7 RealTime/IntraDay
- VectorVest AutoTester
- VectorVest Educational Services
- VectorVest OnLine
- VectorVest Options Analyzer
- VectorVest ProGraphics v6.0
- VectorVest ProTrader 7
- VectorVest RealTime Derby Tool
- VectorVest Simulator
- VectorVest Variator
- VectorVest Watchdog
