

HOT TOPICS LIST
- MACD
- Fibonacci
- RSI
- Gann
- ADXR
- Stochastics
- Volume
- Triangles
- Futures
- Cycles
- Volatility
- ZIGZAG
- MESA
- Retracement
- Aroon
INDICATORS LIST
LIST OF TOPICS
PRINT THIS ARTICLE
by David Penn
High-volume trendline breakdowns aren't always all they're cracked up to be.
Position: N/A
David Penn
Technical Writer for Technical Analysis of STOCKS & COMMODITIES magazine, Working-Money.com, and Traders.com Advantage.
PRINT THIS ARTICLE
VOLUME
Vouching for Volume
03/07/03 11:37:00 AMby David Penn
High-volume trendline breakdowns aren't always all they're cracked up to be.
Position: N/A
| What exactly does a high volume price move mean in the markets? During bull markets, when there seems to be everlasting demand, high volume price moves in one direction tend to be followed by more price action in the same direction. Even if the volume retreated somewhat, the concept of momentum had such credence that many investors and traders looked for high volume price moves almost as a green light to invest or trade immediately in the direction of the move. A high volume up move? Buy with both fists. A high volume sell move? Sell everything you own. |
| For those operating on shorter time frames--days to weeks--this conventional wisdom can be dangerous. Many times, for example, a sharp price rally on high volume after an extended decline leads not to follow-through advances over the next few days, but to losses as the prevailing trend tries to reassert itself. This is because in the shorter term, an exceptionally large buying or selling day often means that the ranks of buyers or sellers will be at least temporarily depleted. Whether or not the trend does in fact manage to resume after the strong countertrend move, many of those who took shorter-term positions based on the countertrend move will find themselves stopped out as the market instead resumes its prevailing trend, perhaps retesting a high or low. |
|
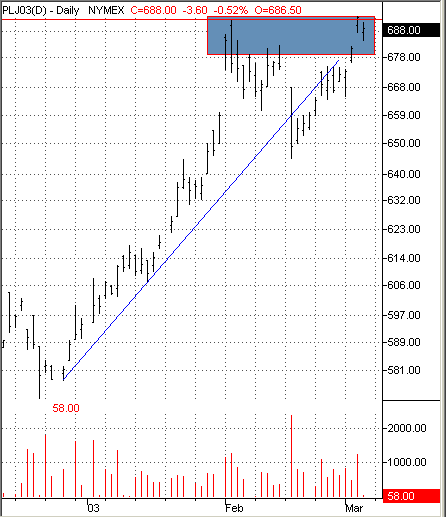
| The big volume trendline break was suggestive of a trend reversal, but a failed test of top may prove more decisive. |
| Graphic provided by: TradeStation. |
| |
| The chart of April platinum provides an example of why it can be problematic to call a turn in a given market based on the first, high-volume countermove. Platinum has been in a bull market since breaking out from a diamond bottom in October 2001. In mid-February (basis April futures), an uptrend line that had been in place since late December was broken on volume that was the contract's highest. Given the length of the bull market that had preceded the break, the odds that a trend reversal was looming were great. The only question was: did "this" high-volume break represent the reversal of the trend? |
| As of early March, the question remained unanswered. Why? Immediately after the trendline break on high volume, prices for April platinum began to rise. As the chart shows, the high-volume trendline break day took platinum from above 669 to about 650. But at 650, platinum began to rise, closing at 654.80 the following day and 656.50 the day afterward. In fact, after the "decisive" break, platinum prices rose for seven straight days, taking out the high of the break day one week later. By March 5, April platinum was trading around 691 and testing contract highs. |
| Does this mean that the break was not decisive, after all? The level of selling on the break day was too overwhelming to be ignored. But, as I suggested above, that level of selling was likely not sustainable at this point. The break likely represented the first dent in the confidence of the intermediate term platinum bulls. In order to truly shake them from their convictions, a failed test of top--perhaps in the form of a 2B test of top (see "Copper Tops," February 28, 2003, Traders.com Advantage for a recent example and explanation)--would probably have to occur. In short, this would mean prices making a new contract high in April platinum, and then retreating, depriving the new high of any follow-through price action. |
Technical Writer for Technical Analysis of STOCKS & COMMODITIES magazine, Working-Money.com, and Traders.com Advantage.
| Title: | Technical Writer |
| Company: | Technical Analysis, Inc. |
| Address: | 4757 California Avenue SW |
| Seattle, WA 98116 | |
| Phone # for sales: | 206 938 0570 |
| Fax: | 206 938 1307 |
| Website: | www.Traders.com |
| E-mail address: | DPenn@traders.com |
Traders' Resource Links | |
| Charting the Stock Market: The Wyckoff Method -- Books | |
| Working-Money.com -- Online Trading Services | |
| Traders.com Advantage -- Online Trading Services | |
| Technical Analysis of Stocks & Commodities -- Publications and Newsletters | |
| Working Money, at Working-Money.com -- Publications and Newsletters | |
| Traders.com Advantage -- Publications and Newsletters | |
| Professional Traders Starter Kit -- Software | |
Click here for more information about our publications!
Comments
Date:�03/09/03Rank:�4Comment:�
Date:�03/12/03Rank:�5Comment:�
Date:�03/15/03Rank:�5Comment:�
Date:�03/29/03Rank:�2Comment:�

Request Information From Our Sponsors
- StockCharts.com, Inc.
- Candle Patterns
- Candlestick Charting Explained
- Intermarket Technical Analysis
- John Murphy on Chart Analysis
- John Murphy's Chart Pattern Recognition
- John Murphy's Market Message
- MurphyExplainsMarketAnalysis-Intermarket Analysis
- MurphyExplainsMarketAnalysis-Visual Analysis
- StockCharts.com
- Technical Analysis of the Financial Markets
- The Visual Investor
- VectorVest, Inc.
- Executive Premier Workshop
- One-Day Options Course
- OptionsPro
- Retirement Income Workshop
- Sure-Fire Trading Systems (VectorVest, Inc.)
- Trading as a Business Workshop
- VectorVest 7 EOD
- VectorVest 7 RealTime/IntraDay
- VectorVest AutoTester
- VectorVest Educational Services
- VectorVest OnLine
- VectorVest Options Analyzer
- VectorVest ProGraphics v6.0
- VectorVest ProTrader 7
- VectorVest RealTime Derby Tool
- VectorVest Simulator
- VectorVest Variator
- VectorVest Watchdog