HOT TOPICS LIST
- MACD
- Fibonacci
- RSI
- Gann
- ADXR
- Stochastics
- Volume
- Triangles
- Futures
- Cycles
- Volatility
- ZIGZAG
- MESA
- Retracement
- Aroon
INDICATORS LIST
LIST OF TOPICS
PRINT THIS ARTICLE
by Gary Grosschadl
This stock has enjoyed a nice ride up, however its bullish strength appears to be waning.
Position: N/A
Gary Grosschadl
Independent Canadian equities trader and technical analyst based in Peterborough
Ontario, Canada.
PRINT THIS ARTICLE
DOUBLE TOPS
Apollo Group Inc.-- Strength In Question
03/07/03 12:20:35 PMby Gary Grosschadl
This stock has enjoyed a nice ride up, however its bullish strength appears to be waning.
Position: N/A
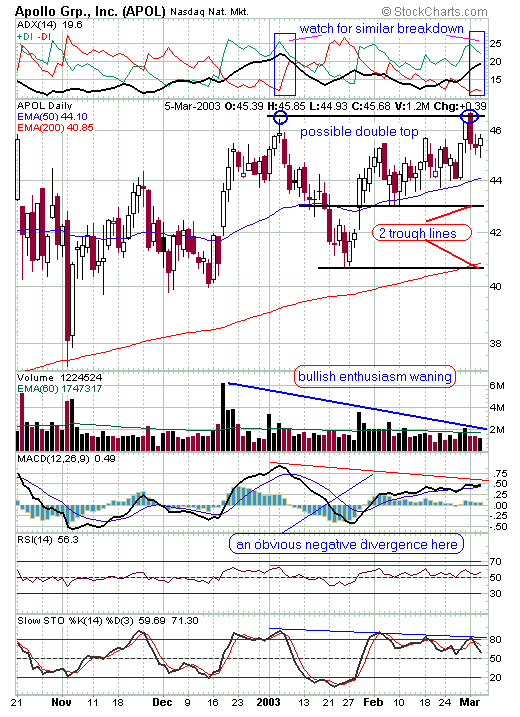
| In the longer term, Apollo Group Inc. (APOL) is still bullish because it is trading above its 50- and 200-day EMAs. But in the short-term it shows signs of weakening and this brings up the query-- Is this stock in double top danger? The daily chart certainly shows several reasons why stockholders should consider using a trailing stop to protect profits. As a suggestion, this trailing stop (preferably on a closing price, not intraday) could be placed just below $44, Apollo's current 50-day EMA. |
| The volume pattern is not good, with the volume trend being down while the stock price has been rising. This shows that fewer bulls are enthused with the continuing rise. This stock has been running countertrend to the markets and traders must be wondering how long this can continue. The possible double top shows less volume at the proposed second top and this again shows fewer traders willing to support the stock's price. This adds weight to the double top notion. |

|
| Graphic provided by: StockCharts.com. |
| |
| Let's examine what the other indicators are hinting at. The directional movement indicator (top of chart) still has a bullish ADX line but the DI lines show early signs of converging. Looking back at the previous top, the ADX/DIs reversed course as a spinning top candlestick marked a top. Now we had another bearish candlestick warning - a bearish engulfing candle and the ADX/DIs may be also starting to reverse course. Watch for further deterioration going forward. The MACD (moving average convergence/divergence) is showing its own bearish warning sign via an obvious negative divergence to price action. This indicator failed to match a previous high as the stock price did. This is often a reliable early warning sign saying that all is not well with the recent rise. The RSI and stochastics indicators show a smaller negative divergence. |
| Should the stock weaken below its 50-day EMA, currently at $44.10, this may signal the start of a bigger decline. The chart suggests two possible trough lines, one at $41 and the other at $43, that could act as either support or failure points for a measured decline. The distance from either trough line and the double top is applied to the trough line to the downside to give possible downside targets should the double top be fulfilled. These measurements are roughly $43 - 4 = $39 and $41 - 6 = $35. Before this happens the stock would have to drop below a rather important support level at $40.85, the 200-day EMA shown on the chart. This could act as strong support and traders should watch this level closely should this bearish move happen. A move above the recent double top would negate this bearish view. |
Independent Canadian equities trader and technical analyst based in Peterborough
Ontario, Canada.
| Website: | www.whatsonsale.ca/financial.html |
| E-mail address: | gwg7@sympatico.ca |
Click here for more information about our publications!
PRINT THIS ARTICLE

Request Information From Our Sponsors
- StockCharts.com, Inc.
- Candle Patterns
- Candlestick Charting Explained
- Intermarket Technical Analysis
- John Murphy on Chart Analysis
- John Murphy's Chart Pattern Recognition
- John Murphy's Market Message
- MurphyExplainsMarketAnalysis-Intermarket Analysis
- MurphyExplainsMarketAnalysis-Visual Analysis
- StockCharts.com
- Technical Analysis of the Financial Markets
- The Visual Investor
- VectorVest, Inc.
- Executive Premier Workshop
- One-Day Options Course
- OptionsPro
- Retirement Income Workshop
- Sure-Fire Trading Systems (VectorVest, Inc.)
- Trading as a Business Workshop
- VectorVest 7 EOD
- VectorVest 7 RealTime/IntraDay
- VectorVest AutoTester
- VectorVest Educational Services
- VectorVest OnLine
- VectorVest Options Analyzer
- VectorVest ProGraphics v6.0
- VectorVest ProTrader 7
- VectorVest RealTime Derby Tool
- VectorVest Simulator
- VectorVest Variator
- VectorVest Watchdog
