HOT TOPICS LIST
- MACD
- Fibonacci
- RSI
- Gann
- ADXR
- Stochastics
- Volume
- Triangles
- Futures
- Cycles
- Volatility
- ZIGZAG
- MESA
- Retracement
- Aroon
INDICATORS LIST
LIST OF TOPICS
PRINT THIS ARTICLE
by Koos van der Merwe
AMT is a share that has shown good strength in a volatile, uncertain market. As the market drops with the advent of war, should it occur, it is a share that I would like to hold.
Position: Accumulate
Koos van der Merwe
Has been a technical analyst since 1969, and has worked as a futures and options trader with First Financial Futures in Johannesburg, South Africa.
PRINT THIS ARTICLE
MOVING AVERAGES
American Tower Corporation
03/07/03 12:14:38 PMby Koos van der Merwe
AMT is a share that has shown good strength in a volatile, uncertain market. As the market drops with the advent of war, should it occur, it is a share that I would like to hold.
Position: Accumulate
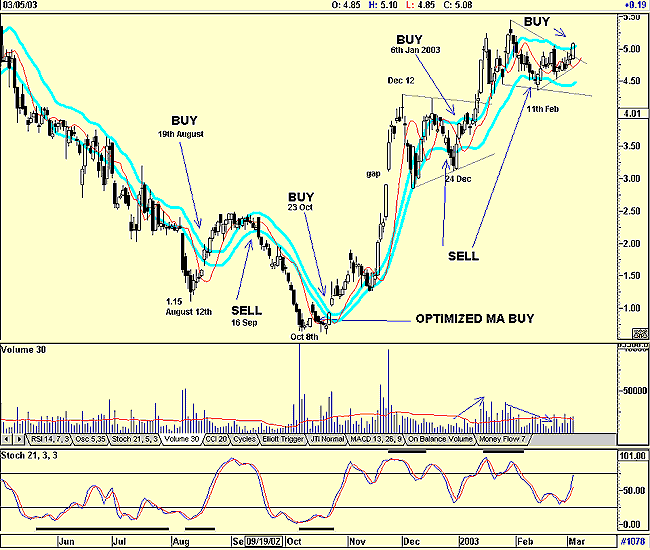
| American Tower Corporation (AMT) is a wireless communications and broadcast infrastructure company. The company operates a leading network of communications towers and is the largest independent operator of broadcast towers in North America. The company provides comprehensive network development services for wireless service providers and broadcasters. They also operate a leading teleport business, which transmits internet, voice, data and video communications worldwide. The share attracted my attention because it is strong with above average volume in a market that is generally weak and uncertain of itself. The chart looks like a long-term hold, so I am using the more conservative "JM Band" for my analysis. The JM Band is a 15-day moving average of the closing price, offset by 2% up and down. The advantage of the indicator is that it will always move in the direction of the market. It can be used with a momentum indicator for better results. |
| AMT's chart shows how the share price moved down to form a bottom on August 12th, 2002 at $1.15. On August 19th the share price gave a buy signal at $1.92 on good volume and on a rising stochastic (21,3,3). However it then moved sideways and gave a sell signal at $2.09 on September 16th. It then continued falling giving a short sell signal on low volume on September 16th to form a second low on October 8th at $0.61. The sell on low volume, is a sign of strength, so I would not have taken it, and probably missed a good profit. But it was also telling me that the next buy signal would be good and must be taken, even earlier than a break above the upper JM band line. Because of this, I would probably have added an optimized moving average (red line on chart) and purchased on any break above the line. With the stochastic oversold, I would have felt confident. |

|
| American Tower Corp. |
| Graphic provided by: CQG. |
| |
| On the negative side, the extremely high volume and sell-off as the price bottomed, should have caused me to hesitate and wait. The strength of the share price, on above average volume, while breaking the upper JM Band with a gap, would have made me a buyer, even though volume fell to below average soon after. I would have stayed a buyer until the sell signal at $3.44 on the December 24, 2002. On January 6, 2003, on low volume, the share gave a buy signal, retraced and reconfirmed the buy signal on good volume. The stochastic, although not reaching an oversold position before reversing direction, suggested the upside may be limited, and after reaching a high of $5.45 on January 30th, volume started falling. I would have been taken out with a rising stop-loss signal had I held. In actual fact, I would probably have sold after the high of $5.22 on the 16th of January. On February 11th, I would have received a short sell on low volume, and taken a loss as the market unexpectedly reversed itself. |
| The share price has now given a buy signal on above average volume. The stochastic oscillator is moving up, once again without reaching an oversold (below 20) position suggesting caution. What is encouraging however, is the "flag" pattern that has formed, and the break above the resistance line. |
Has been a technical analyst since 1969, and has worked as a futures and options trader with First Financial Futures in Johannesburg, South Africa.
| Address: | 3256 West 24th Ave |
| Vancouver, BC | |
| Phone # for sales: | 6042634214 |
| E-mail address: | petroosp@gmail.com |
Click here for more information about our publications!
Comments
Date: 03/15/03Rank: 5Comment:

|

Request Information From Our Sponsors
- StockCharts.com, Inc.
- Candle Patterns
- Candlestick Charting Explained
- Intermarket Technical Analysis
- John Murphy on Chart Analysis
- John Murphy's Chart Pattern Recognition
- John Murphy's Market Message
- MurphyExplainsMarketAnalysis-Intermarket Analysis
- MurphyExplainsMarketAnalysis-Visual Analysis
- StockCharts.com
- Technical Analysis of the Financial Markets
- The Visual Investor
- VectorVest, Inc.
- Executive Premier Workshop
- One-Day Options Course
- OptionsPro
- Retirement Income Workshop
- Sure-Fire Trading Systems (VectorVest, Inc.)
- Trading as a Business Workshop
- VectorVest 7 EOD
- VectorVest 7 RealTime/IntraDay
- VectorVest AutoTester
- VectorVest Educational Services
- VectorVest OnLine
- VectorVest Options Analyzer
- VectorVest ProGraphics v6.0
- VectorVest ProTrader 7
- VectorVest RealTime Derby Tool
- VectorVest Simulator
- VectorVest Variator
- VectorVest Watchdog
