

HOT TOPICS LIST
- MACD
- Fibonacci
- RSI
- Gann
- ADXR
- Stochastics
- Volume
- Triangles
- Futures
- Cycles
- Volatility
- ZIGZAG
- MESA
- Retracement
- Aroon
INDICATORS LIST
LIST OF TOPICS
PRINT THIS ARTICLE
by Gary Grosschadl
This Nasdaq 100 stock is showing a descending triangle which is bearish.
Position: N/A
Gary Grosschadl
Independent Canadian equities trader and technical analyst based in Peterborough
Ontario, Canada.
PRINT THIS ARTICLE
DESCENDING TRIANGLES
Novellus Looking Weak
03/06/03 09:13:53 AMby Gary Grosschadl
This Nasdaq 100 stock is showing a descending triangle which is bearish.
Position: N/A
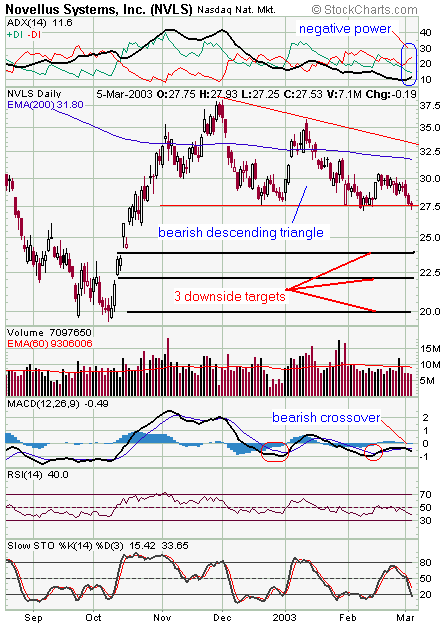
| This daily chart of Novellus (NVLS) shows weakness but it needs to go below 27.5, its lower trendline, with some conviction (higher volume) to warrant selling or shorting. The question is whether it will try for another weak stochastic upleg before failing once again, possibly with bigger downside implications. Note how the last upleg was weaker as it fell far short of the upper trendline. |
| The directional movement indicator (on top) shows negative power building. The DI components are in a bearish formation (-DI on top) and ADX heading up. Once ADX is inbetween the DIs, bearish power builds even more. The MACD (moving average convergence/divergence) is also showing bearish signs via a bearish crossover of the faster MA line through the slower signal line. The RSI line is also weak being under the 50 level and still heading down. The stochastics line is heading into oversold territory so a bounce soon is not out of the question. This is why it is prudent not to jump the gun, instead waiting to see whether Novellus bounces or breaks down. |
|
| Graphic provided by: stockcharts.com. |
| |
| Once a breakdown through the lower trendline occurs, I am showing three targets or possible support areas. Stocks will often find support (sometimes only temporarily) at previous gaps, so the first two possible targets lie at previous gaps. Watch for either strong reversal patterns there or hesitations hinting at further declines to come. By measuring the widest part of the descending triangle and applying it to the downside break of the trendline, we get a potential downside of $10. This easily brings it down to the $20 target area and possibly matches the low of last October. |
| So in summary, Novellus is on a breakdown watch. A larger volume move below this trendline could start the decline. However with stochastics already fairy low it could also try a weak bounce off the trendline before setting up for a more convincing breakdown. The prudent trader should wait for a stronger signal before proceeding. |
Independent Canadian equities trader and technical analyst based in Peterborough
Ontario, Canada.
| Website: | www.whatsonsale.ca/financial.html |
| E-mail address: | gwg7@sympatico.ca |
Click here for more information about our publications!
Comments
Date:�03/06/03Rank:�5Comment:�Question -Some people believe that a market bottom is in place in the NASDAQ. DO you feel the gaps at the 1170 and 1230 areas need to be filled in order for a bottom to be confirmed? Must there be a re-test of the OCtober lows? These gaps correspond to the NVLS chart.
Date:�03/06/03Rank:�4Comment:�
Date:�03/15/03Rank:�5Comment:�

Request Information From Our Sponsors
- StockCharts.com, Inc.
- Candle Patterns
- Candlestick Charting Explained
- Intermarket Technical Analysis
- John Murphy on Chart Analysis
- John Murphy's Chart Pattern Recognition
- John Murphy's Market Message
- MurphyExplainsMarketAnalysis-Intermarket Analysis
- MurphyExplainsMarketAnalysis-Visual Analysis
- StockCharts.com
- Technical Analysis of the Financial Markets
- The Visual Investor
- VectorVest, Inc.
- Executive Premier Workshop
- One-Day Options Course
- OptionsPro
- Retirement Income Workshop
- Sure-Fire Trading Systems (VectorVest, Inc.)
- Trading as a Business Workshop
- VectorVest 7 EOD
- VectorVest 7 RealTime/IntraDay
- VectorVest AutoTester
- VectorVest Educational Services
- VectorVest OnLine
- VectorVest Options Analyzer
- VectorVest ProGraphics v6.0
- VectorVest ProTrader 7
- VectorVest RealTime Derby Tool
- VectorVest Simulator
- VectorVest Variator
- VectorVest Watchdog