HOT TOPICS LIST
- MACD
- Fibonacci
- RSI
- Gann
- ADXR
- Stochastics
- Volume
- Triangles
- Futures
- Cycles
- Volatility
- ZIGZAG
- MESA
- Retracement
- Aroon
INDICATORS LIST
LIST OF TOPICS
PRINT THIS ARTICLE
by Koos van der Merwe
Using my on balance volume setup, Vodaphone is giving a sell signal.
Position: Sell
Koos van der Merwe
Has been a technical analyst since 1969, and has worked as a futures and options trader with First Financial Futures in Johannesburg, South Africa.
PRINT THIS ARTICLE
ON BALANCE VOLUME
Vodaphone and On Balance Volume
03/06/03 01:19:43 PMby Koos van der Merwe
Using my on balance volume setup, Vodaphone is giving a sell signal.
Position: Sell
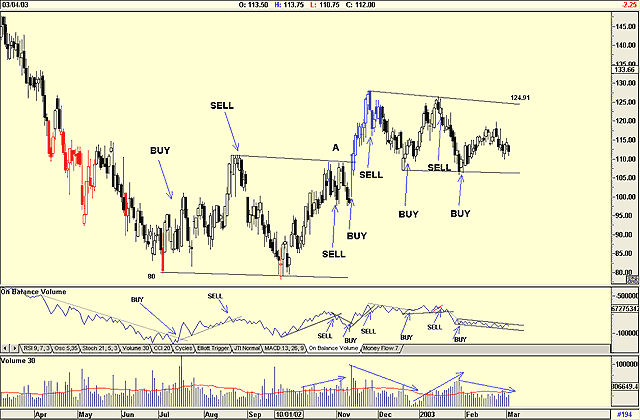
| When computers first hit the market, Joe Granville developed his on balance volume strategy. This was one of the first successful indicators around, and the way Joe marketed his newsletter using the strategy, was a winner. The chart below is of Vodaphone, with the prices from the London stock exchange shown in cents, rather than dollars. Vodaphone is one of the world's largest mobile telecommunications network companies with interests in 28 countries throughout the world. It is listed on the New York stock exchange, but I prefer looking at its English data, reflecting fundamental data that is free of currency fluctations between the pound sterling and the US$. |
| My chart of Vodaphone does not show how the share fell from the high of 401, but it does suggest that the price could be strengthening from the low of 80 in July 2002. Soon after the low, the OBV index gave a buy signal on rising volume. |

|
| Vodaphone and on balance volume. |
| Graphic provided by: AdvancedGET. |
| |
| I have marked the buy and sell signals given by the OBV signal, and I must admit that I found this not easy for the following reason. There are three phases to an OBV signal: buy, neutral, and sell. The OBV signal works in the following way. You start from any number, let's say 100. If the price rises, then add the volume to this number. If the price falls, subtract the volume from this number, then draw a chart as shown, with trendlines. A break above the trendline gives a buy signal, and a break below the trendline gives a sell signal. I have shown this quite clearly on the chart. |
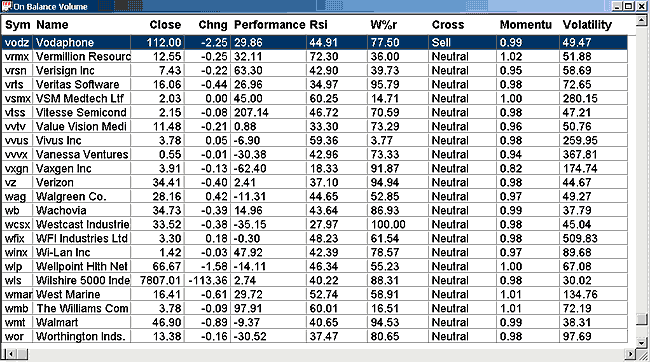
The problem I find, however, is that I have difficulty in deciding when the OBV indicator is in neutral mode-- that is, when it is neither a buy or a sell. So I looked for another program that would give me a buy, sell or neutral signal. Figure 2: My setup for the on balance volume indicator. To do this, I turned to Technifilter Plus and entererd the parameters I wanted. These are: ticker, share name, close, change, performance, RSI, Williams %R, cross, momentum, and volatility. Figure 2 shows my setup. "Cross" shows the OBV signal, and Technilter Plus labels the signal: buy, sell or neutral. As you can see from the chart, Vodaphone has given a sell signal on recent data. |
| I use all the other indicators as a visual aides so I can compare the relative movements of the shares with each other. With Technifilter Plus suggesting that Vodaphone is in sell mode, I would have sold, even though the OBV chart on the GET program is suggesting it could be in neutral after a buy signal. Today Joe Granville has almost faded from the scene. His OBV strategy is rarely used, and yet it is one of the strategies that should be an arrow in every technician's quiver. Many variations of OBV have appeared, all trying to improve on the original formula. A few have done so, but used correctly, OBV is still a powerful indicator. |
Has been a technical analyst since 1969, and has worked as a futures and options trader with First Financial Futures in Johannesburg, South Africa.
| Address: | 3256 West 24th Ave |
| Vancouver, BC | |
| Phone # for sales: | 6042634214 |
| E-mail address: | petroosp@gmail.com |
Click here for more information about our publications!
Comments

Request Information From Our Sponsors
- StockCharts.com, Inc.
- Candle Patterns
- Candlestick Charting Explained
- Intermarket Technical Analysis
- John Murphy on Chart Analysis
- John Murphy's Chart Pattern Recognition
- John Murphy's Market Message
- MurphyExplainsMarketAnalysis-Intermarket Analysis
- MurphyExplainsMarketAnalysis-Visual Analysis
- StockCharts.com
- Technical Analysis of the Financial Markets
- The Visual Investor
- VectorVest, Inc.
- Executive Premier Workshop
- One-Day Options Course
- OptionsPro
- Retirement Income Workshop
- Sure-Fire Trading Systems (VectorVest, Inc.)
- Trading as a Business Workshop
- VectorVest 7 EOD
- VectorVest 7 RealTime/IntraDay
- VectorVest AutoTester
- VectorVest Educational Services
- VectorVest OnLine
- VectorVest Options Analyzer
- VectorVest ProGraphics v6.0
- VectorVest ProTrader 7
- VectorVest RealTime Derby Tool
- VectorVest Simulator
- VectorVest Variator
- VectorVest Watchdog
