HOT TOPICS LIST
- MACD
- Fibonacci
- RSI
- Gann
- ADXR
- Stochastics
- Volume
- Triangles
- Futures
- Cycles
- Volatility
- ZIGZAG
- MESA
- Retracement
- Aroon
INDICATORS LIST
LIST OF TOPICS
PRINT THIS ARTICLE
by Gary Grosschadl
This Canadian high tech player (graphic chip maker) is showing an interesting chart entry as a long position.
Position: Buy
Gary Grosschadl
Independent Canadian equities trader and technical analyst based in Peterborough
Ontario, Canada.
PRINT THIS ARTICLE
Possible Cycle Low For ATI Technologies
03/04/03 01:20:35 PMby Gary Grosschadl
This Canadian high tech player (graphic chip maker) is showing an interesting chart entry as a long position.
Position: Buy
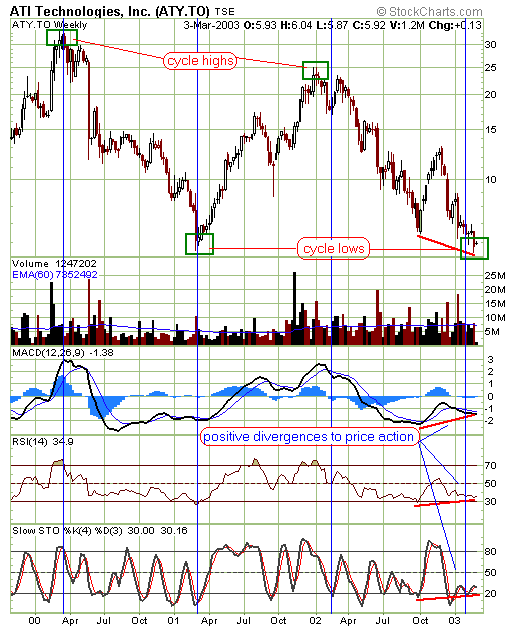
| The weekly chart (drawn March 10, 2003) shows several reasons why I favor ATI Technologies (ATI.to) as a buy at this level. When various indicators show positive divergence to price action, it is often a good time to consider a long entry. In this case the MACD (moving average convergence/divergence), RSI (relative strength index) and stochastics all show a positive divergence to price action. This suggests a good likelihood of an upleg starting very soon. |
| Adding weight to this bullish consideration is the fact that we are probably at a cycle low here. Note the equidistant cycle lines drawn on the chart starting from 2000. |

|
| Graphic provided by: stockcharts.com. |
| |
| Upside projections taken from the daily chart suggest several targets. The first important one is the $6.32 mark which is the overhead 20-period EMA (exponential moving average) resistance. Once the stock can show strength above this test then the next level to watch is $6.85 - $7.16. This is the top Bollinger Band resistance and the 50-period EMA . (For clarity reasons the EMAs and Bollinger Bands are not shown on the chart.) Beyond that the $8 - $10 region will provide plenty of resistance as profit takers will cash in. At any rate watch for any candlestick reversal patterns--such as evening stars, bearish engulfing or dark cloud cover to name a few-- along the way . |
Independent Canadian equities trader and technical analyst based in Peterborough
Ontario, Canada.
| Website: | www.whatsonsale.ca/financial.html |
| E-mail address: | gwg7@sympatico.ca |
Click here for more information about our publications!
Comments
Date: 03/04/03Rank: 4Comment:
Date: 03/15/03Rank: 5Comment:

|

Request Information From Our Sponsors
- StockCharts.com, Inc.
- Candle Patterns
- Candlestick Charting Explained
- Intermarket Technical Analysis
- John Murphy on Chart Analysis
- John Murphy's Chart Pattern Recognition
- John Murphy's Market Message
- MurphyExplainsMarketAnalysis-Intermarket Analysis
- MurphyExplainsMarketAnalysis-Visual Analysis
- StockCharts.com
- Technical Analysis of the Financial Markets
- The Visual Investor
- VectorVest, Inc.
- Executive Premier Workshop
- One-Day Options Course
- OptionsPro
- Retirement Income Workshop
- Sure-Fire Trading Systems (VectorVest, Inc.)
- Trading as a Business Workshop
- VectorVest 7 EOD
- VectorVest 7 RealTime/IntraDay
- VectorVest AutoTester
- VectorVest Educational Services
- VectorVest OnLine
- VectorVest Options Analyzer
- VectorVest ProGraphics v6.0
- VectorVest ProTrader 7
- VectorVest RealTime Derby Tool
- VectorVest Simulator
- VectorVest Variator
- VectorVest Watchdog
