HOT TOPICS LIST
- MACD
- Fibonacci
- RSI
- Gann
- ADXR
- Stochastics
- Volume
- Triangles
- Futures
- Cycles
- Volatility
- ZIGZAG
- MESA
- Retracement
- Aroon
INDICATORS LIST
LIST OF TOPICS
PRINT THIS ARTICLE
by Koos van der Merwe
A weekly triple bottom points to new opportunities with WebMD.
Position: Accumulate
Koos van der Merwe
Has been a technical analyst since 1969, and has worked as a futures and options trader with First Financial Futures in Johannesburg, South Africa.
PRINT THIS ARTICLE
CHART ANALYSIS
WebMD Corporation
02/28/03 12:50:15 PMby Koos van der Merwe
A weekly triple bottom points to new opportunities with WebMD.
Position: Accumulate
| The threatened war against Iraq has made the market very uncertain, with many investors preferring to sit on the sidelines and wait for the invasion of Iraq, rather than jump in and test the water now. The shrewd investors are hopefully following the advice of Warren Buffet and Sir John Templeton, waiting for everyone else to sell before buying. They have prepared their list of preferred stocks and equities, and are now waiting, waiting and waiting. WebMD Corporation (HLTH) is one company that could appear on that list. WebMD Health is the leading provider of online information, educational services and communities for physicians and consumers. Their WebMD Medical Manager division is the leading provider of physician practice management software and related services, and WebMD Envoy is the leading provider of electronic data interchange services for healthcare providers and commercial health plans. |
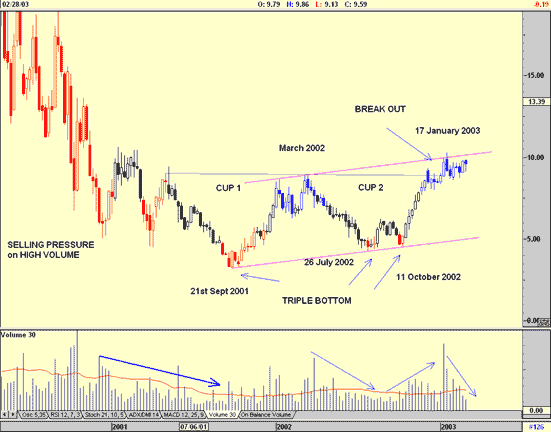
| The weekly chart below shows that, since September 2001, the market has suddenly started looking at the corporation with new eyes. As technicians, we believe that everything about a corporation is reflected in their chart and WebMD is no exception. |

|
| Figure 1: Weekly chart of WebMD. |
| Graphic provided by: AdvancedGET. |
| |
| The chart shows how the share price fell dramatically with high weekly volatility and on above average volume until the 21st of September, 2001. From there it formed the first of the triple bottoms that developed over the next year. The chart shows how the turn was anticipated as selling volume dried up with selling pressure, and weekly volatility started to look normal. The price then formed the first of two cup and handle formations but failed to give a buy signal after the first attempt, falling back on above average volume to form the second bottom on July 26, 2002, and then the third bottom on October 11, 2002. The decline starting in March 2002, was on falling volume, suggesting strength, but the length of time from March to July, could have discouraged investors. The low formed in July 2002 and again in October 2002, established a sound support line, the parallel of which, drawn from the high in March was tested in January 2003. The price then moved sideways on falling volume suggesting that a breakout could be imminent on a handle that now appears to be forming. To confirm this, I turned to the daily chart. |
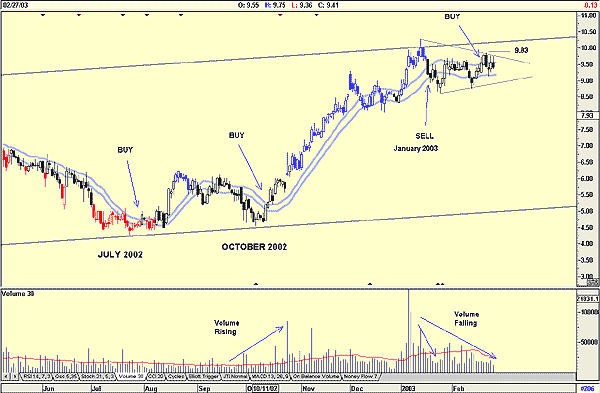
 Figure 2: Daily chart of WebMD. With the daily chart, I have inserted the JM trading band as shown. This band is a 15-day moving average offset by 2% on either side. I use the JM trading band for long-term investments as it is a conservative indicator, always trading in the direction of the trend. I use a stop-loss to close a position. |
| The chart shows that in July 2002, the second low forming the triple bottom (see weekly chart), I would have bought the share had I been confident enough in the company. Chances are that I would have waited until the second bottom in October and the BUY signal given soon thereafter on rising volume before I bought. I would have sold in January 2003, and then regretted my decision as the share price starting consolidating. The falling volume should have tipped me off that any sell signal given would be brief, but my rule is not to second guess the strategy. I would buy again in February at the recent break above the upper JM band line, and will now expect a break above the $9.83 level of the upper trendline with a rise to, possibly $15, a target calculated on the weekly cup and handle formation. WebMD Corporation is a share worth buying, especially when the market falls as expected with the invasion of Iraq. The fact that this share has held up well in the recent market uncertainty, speaks for itself. |
Has been a technical analyst since 1969, and has worked as a futures and options trader with First Financial Futures in Johannesburg, South Africa.
| Address: | 3256 West 24th Ave |
| Vancouver, BC | |
| Phone # for sales: | 6042634214 |
| E-mail address: | petroosp@gmail.com |
Click here for more information about our publications!
Comments
Date: 02/28/03Rank: 5Comment:

Request Information From Our Sponsors
- VectorVest, Inc.
- Executive Premier Workshop
- One-Day Options Course
- OptionsPro
- Retirement Income Workshop
- Sure-Fire Trading Systems (VectorVest, Inc.)
- Trading as a Business Workshop
- VectorVest 7 EOD
- VectorVest 7 RealTime/IntraDay
- VectorVest AutoTester
- VectorVest Educational Services
- VectorVest OnLine
- VectorVest Options Analyzer
- VectorVest ProGraphics v6.0
- VectorVest ProTrader 7
- VectorVest RealTime Derby Tool
- VectorVest Simulator
- VectorVest Variator
- VectorVest Watchdog
- StockCharts.com, Inc.
- Candle Patterns
- Candlestick Charting Explained
- Intermarket Technical Analysis
- John Murphy on Chart Analysis
- John Murphy's Chart Pattern Recognition
- John Murphy's Market Message
- MurphyExplainsMarketAnalysis-Intermarket Analysis
- MurphyExplainsMarketAnalysis-Visual Analysis
- StockCharts.com
- Technical Analysis of the Financial Markets
- The Visual Investor
