HOT TOPICS LIST
- MACD
- Fibonacci
- RSI
- Gann
- ADXR
- Stochastics
- Volume
- Triangles
- Futures
- Cycles
- Volatility
- ZIGZAG
- MESA
- Retracement
- Aroon
INDICATORS LIST
LIST OF TOPICS
PRINT THIS ARTICLE
by David Penn
While wheat and corn struggle to establish a bottom, soybeans consolidate for what might be another leg up.
Position: N/A
David Penn
Technical Writer for Technical Analysis of STOCKS & COMMODITIES magazine, Working-Money.com, and Traders.com Advantage.
PRINT THIS ARTICLE
ASCENDING TRIANGLES
Ascending Triangle in Soybeans
02/27/03 09:07:04 AMby David Penn
While wheat and corn struggle to establish a bottom, soybeans consolidate for what might be another leg up.
Position: N/A
| Recently in a Traders.com Advantage article, "A Bottom in Grains?" (posted February 18, 2003), I suggested that the grains--as represented by wheat and corn futures--appeared to be establishing bottoms after significant downtrends. Since the beginning of February, the diamond bottom in corn I pointed out has broken out on the downside, but has yet to establish a closing low below the bottom of the diamond. Thus, while the immediate-term look on corn is bearish (which coincides with the intermediate-term trend), the fact that corn has not closed under the low of the diamond suggests that a bottom reversal is still quite possible. |
| Similarly, the head and shoulders bottom I pointed to in wheat futures has yet to complete the right shoulder and has, instead, retreated to the level of the lowest point of the left shoulder. I noted this possibility in "A Bottom in Grains?", suggesting that "while a break to 319 at this point would not invalidate the formation's bullish portents, it would be a negative sign given that such a break would likely violate an uptrend line that could be drawn from the lows of late January to the current lows of February." I still believe this to be a valid interpretation, with March wheat currently hovering around 320. |

|
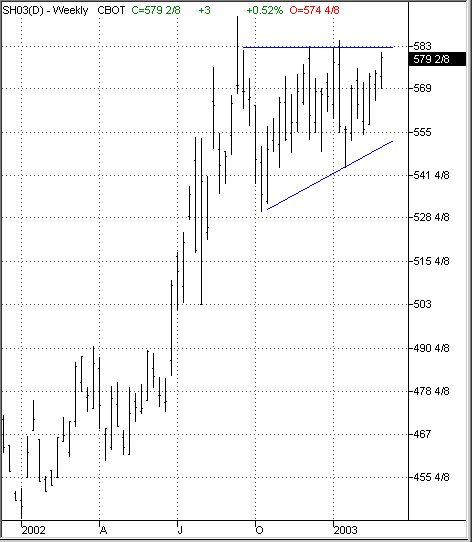
| This ascending triangle could anticipate soybean prices to 630 or higher. |
| Graphic provided by: TradeStation. |
| |
| I did not include soybeans in my previous comments on the grains. This was largely because I believed that soybeans had already bottomed back at the beginning of 2002 and had been in an uptrend more or less ever since. However, the behavior of soybeans--which have been in an ascending triangle shaped consolidation since the third quarter of 2002--may be instructive as to whether or not wheat and corn will eventually move up or, instead, make new lows. |
| The ascending triangle in soybeans (basis March futures) has a fairly clear-cut, upwardly sloping trendline that connects the lows of October (around 530) to the lows of January. The horizontal resistance line is a little more subjective, due largely to the price spike on the 11th and 12th of September 2002. Nevertheless, I think the horizontal resistance at about 580 is sound; there have been three attempts to hold ground above this resistance point since November and all have failed at or slightly above this horizontal resistance line. |
| Ascending triangles such as the one developing in March soybeans act as a sort of coil, with higher lows and near-constant highs compressing prices over time until they eventually break free from the coil. The pattern of higher lows and near-constant highs in an uptrend tends to suggest a break to the upside--just as a pattern of lower highs and near-constant lows in a downtrend tends to suggest a break to the downside. The latter is called a "descending triangle." The former is what appears to be developing in soybeans. Given the formation size of the soybean ascending triangle, a move to 630 should be expected should prices break out on the upside. This could certainly be a minimum move, should it take place, insofar as the nearest resistance (in the form of previous highs) is not only almost twenty points away, it is also more than four years away--namely the bear market rally peak in the third quarter of 1998. |
Technical Writer for Technical Analysis of STOCKS & COMMODITIES magazine, Working-Money.com, and Traders.com Advantage.
| Title: | Technical Writer |
| Company: | Technical Analysis, Inc. |
| Address: | 4757 California Avenue SW |
| Seattle, WA 98116 | |
| Phone # for sales: | 206 938 0570 |
| Fax: | 206 938 1307 |
| Website: | www.Traders.com |
| E-mail address: | DPenn@traders.com |
Traders' Resource Links | |
| Charting the Stock Market: The Wyckoff Method -- Books | |
| Working-Money.com -- Online Trading Services | |
| Traders.com Advantage -- Online Trading Services | |
| Technical Analysis of Stocks & Commodities -- Publications and Newsletters | |
| Working Money, at Working-Money.com -- Publications and Newsletters | |
| Traders.com Advantage -- Publications and Newsletters | |
| Professional Traders Starter Kit -- Software | |
Click here for more information about our publications!
Comments

|

Request Information From Our Sponsors
- VectorVest, Inc.
- Executive Premier Workshop
- One-Day Options Course
- OptionsPro
- Retirement Income Workshop
- Sure-Fire Trading Systems (VectorVest, Inc.)
- Trading as a Business Workshop
- VectorVest 7 EOD
- VectorVest 7 RealTime/IntraDay
- VectorVest AutoTester
- VectorVest Educational Services
- VectorVest OnLine
- VectorVest Options Analyzer
- VectorVest ProGraphics v6.0
- VectorVest ProTrader 7
- VectorVest RealTime Derby Tool
- VectorVest Simulator
- VectorVest Variator
- VectorVest Watchdog
- StockCharts.com, Inc.
- Candle Patterns
- Candlestick Charting Explained
- Intermarket Technical Analysis
- John Murphy on Chart Analysis
- John Murphy's Chart Pattern Recognition
- John Murphy's Market Message
- MurphyExplainsMarketAnalysis-Intermarket Analysis
- MurphyExplainsMarketAnalysis-Visual Analysis
- StockCharts.com
- Technical Analysis of the Financial Markets
- The Visual Investor
