

HOT TOPICS LIST
- MACD
- Fibonacci
- RSI
- Gann
- ADXR
- Stochastics
- Volume
- Triangles
- Futures
- Cycles
- Volatility
- ZIGZAG
- MESA
- Retracement
- Aroon
INDICATORS LIST
LIST OF TOPICS
PRINT THIS ARTICLE
by Gary Grosschadl
Several warning signs point to the possibility of a triple top challenge.
Position: Sell
Gary Grosschadl
Independent Canadian equities trader and technical analyst based in Peterborough
Ontario, Canada.
PRINT THIS ARTICLE
TRITOP/TRI BOTTOM
Symantec's Triple Top Danger
02/27/03 08:54:13 AMby Gary Grosschadl
Several warning signs point to the possibility of a triple top challenge.
Position: Sell
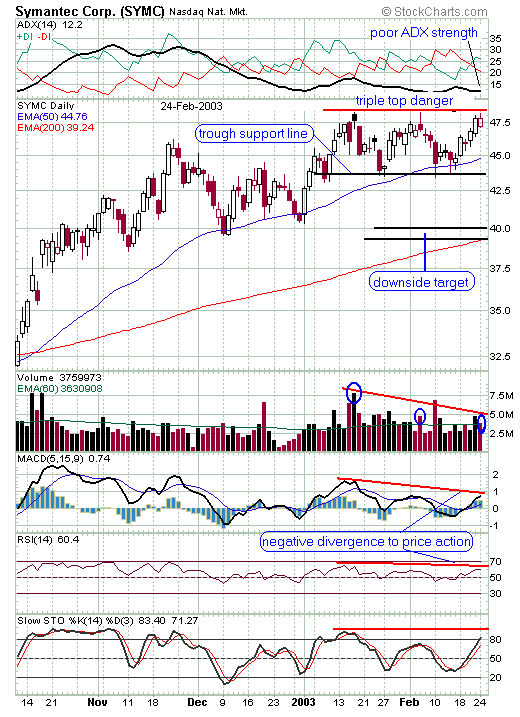
| Triple tops are reversal patterns that form after three relatively equally spaced highs are made. They generally take less time to form than triple bottoms, that being three months. The pattern is not considered valid until trough support is broken. By measurement, if the pattern fulfills to ideal completion, this can lead to a downside target equal to the distance between the trough and top. Volume should decline as the triple top forms and this is apparent in the chart below. |
| There are clues hinting at some downside coming. The directional movement indicator is quite weak with ADX at 12.2 (under 20 is considered weak). This is often the case when the stock is in a non-trending or range-bound phase. For this reason it is best to use the stochastic oscillator to show reversals at overbought and oversold levels. As the stochastic indicator shows, a downleg may soon start as it heads above the 80 level. The implication here is that the stock will head down to the trough level again, ending up around the $43.50 level. |
|
| Graphic provided by: StockCharts.com. |
| |
| Other clues come from negative divergences (to price action) from MACD (moving average convergence/divergence) and the RSI (relative strength index). These indicators failed to move higher as the stock hit its previous peaks. This brings some doubt that the stock will be able to move higher. |
| There are two possible trading strategies going forward. The aggressive short-term trader could play this perceived weakness for a stochastic downleg until the trough line test is reached. This will likely coincide with a stochastic reversal off its oversold level (around 20) as before. The longer term and perhaps the more prudent trader can wait for this trough test to see if support breaks here. If it does, then the triple top is valid and a short position (with a suitable stop) could be taken for the further downside move to around $40. |
Independent Canadian equities trader and technical analyst based in Peterborough
Ontario, Canada.
| Website: | www.whatsonsale.ca/financial.html |
| E-mail address: | gwg7@sympatico.ca |
Click here for more information about our publications!
Comments
Date:�02/28/03Rank:�5Comment:�

Request Information From Our Sponsors
- StockCharts.com, Inc.
- Candle Patterns
- Candlestick Charting Explained
- Intermarket Technical Analysis
- John Murphy on Chart Analysis
- John Murphy's Chart Pattern Recognition
- John Murphy's Market Message
- MurphyExplainsMarketAnalysis-Intermarket Analysis
- MurphyExplainsMarketAnalysis-Visual Analysis
- StockCharts.com
- Technical Analysis of the Financial Markets
- The Visual Investor
- VectorVest, Inc.
- Executive Premier Workshop
- One-Day Options Course
- OptionsPro
- Retirement Income Workshop
- Sure-Fire Trading Systems (VectorVest, Inc.)
- Trading as a Business Workshop
- VectorVest 7 EOD
- VectorVest 7 RealTime/IntraDay
- VectorVest AutoTester
- VectorVest Educational Services
- VectorVest OnLine
- VectorVest Options Analyzer
- VectorVest ProGraphics v6.0
- VectorVest ProTrader 7
- VectorVest RealTime Derby Tool
- VectorVest Simulator
- VectorVest Variator
- VectorVest Watchdog