HOT TOPICS LIST
- MACD
- Fibonacci
- RSI
- Gann
- ADXR
- Stochastics
- Volume
- Triangles
- Futures
- Cycles
- Volatility
- ZIGZAG
- MESA
- Retracement
- Aroon
INDICATORS LIST
LIST OF TOPICS
PRINT THIS ARTICLE
by Koos van der Merwe
With all the uncertainty in the world today, investors are scared to take the plunge and market moves in either direction- up or down- are on low volume. A semi-logarithmic chart of the Nasdaq once again proves that a picture is worth a thousand words.
Position: Accumulate
Koos van der Merwe
Has been a technical analyst since 1969, and has worked as a futures and options trader with First Financial Futures in Johannesburg, South Africa.
PRINT THIS ARTICLE
SUPPORT & RESISTANCE
The Arithmetic Nasdaq Versus the Semi-Logarithmic Nasdaq
02/25/03 10:50:52 AMby Koos van der Merwe
With all the uncertainty in the world today, investors are scared to take the plunge and market moves in either direction- up or down- are on low volume. A semi-logarithmic chart of the Nasdaq once again proves that a picture is worth a thousand words.
Position: Accumulate
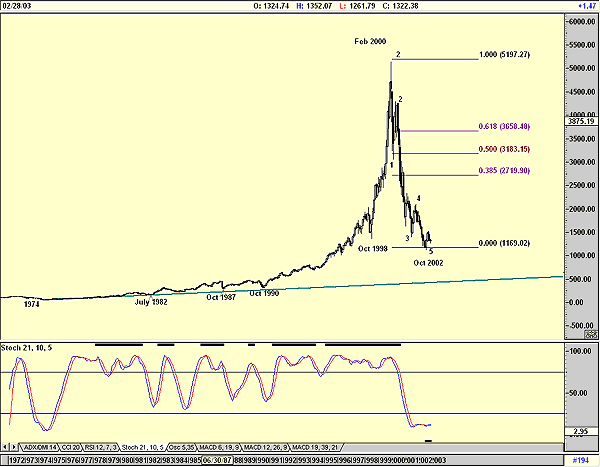
| The chart below is a normal arithmetic chart of the Nasdaq, showing the move up from 1974, topping out in the now familiar spike in February 2000. The guidance I am getting is from the stochastic (21,10,3) only, which is in an oversold position. |

|
| Figure 1: Nasdaq, an arithmetic chart. |
| Graphic provided by: AdvancedGET. |
| |
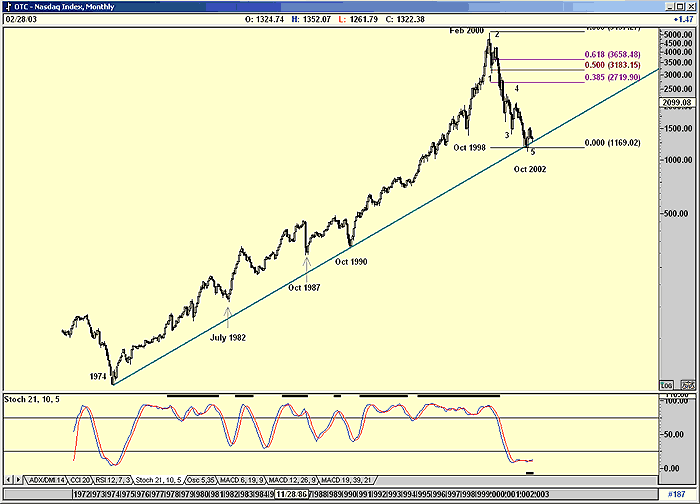
Compare this chart to the next one, a semi-logarithmic chart of the identical data. Figure 2: Nasdaq, semi-logarithmic chart. The chart above is semi-logarithmic monthly chart of the Nasdaq starting from 1974. Notice how the Nasdaq tested the support line in October 1990 and again in October 2002. It is only now, however, that that the stochastic, (21,10, 5) has repeated the 1974 low by falling below the 20 level. This could be a very bullish sign, but could still take some months to establish a strong enough base for the start of a new bull run. A decisive break below this support line will be catastrophic. Do notice the 5 wave Elliott count down, in both charts which in itself is not a good sign, as it suggests that the Nasdaq could be in a major bear market. And that 'Wave A' could have been completed in October 2002, with an ABC up in a 'Wave B' to be followed by a Wave C which could retest the October 1990 lows. However, before this happens the market has to rise in the B Wave, and test any one of the Fibonacci ratio levels shown or even exceed them. B Waves are unpredictable which is why they are also know as bull traps. ( I have not shown an Elliott count of the impulse wave to the top in February 2000, as I would need more data to do so, and I am only looking at the period from 1974 to today.) Then again, my Elliott count may be wrong, and when the Nasdaq starts moving up, it could then begin a new bull market that will last a century. The clarity of the semi-log chart suggests this could be a possibility. |
Has been a technical analyst since 1969, and has worked as a futures and options trader with First Financial Futures in Johannesburg, South Africa.
| Address: | 3256 West 24th Ave |
| Vancouver, BC | |
| Phone # for sales: | 6042634214 |
| E-mail address: | petroosp@gmail.com |
Click here for more information about our publications!
Comments
Date: 03/05/03Rank: 5Comment:
Date: 04/11/03Rank: 3Comment:

|

Request Information From Our Sponsors
- StockCharts.com, Inc.
- Candle Patterns
- Candlestick Charting Explained
- Intermarket Technical Analysis
- John Murphy on Chart Analysis
- John Murphy's Chart Pattern Recognition
- John Murphy's Market Message
- MurphyExplainsMarketAnalysis-Intermarket Analysis
- MurphyExplainsMarketAnalysis-Visual Analysis
- StockCharts.com
- Technical Analysis of the Financial Markets
- The Visual Investor
- VectorVest, Inc.
- Executive Premier Workshop
- One-Day Options Course
- OptionsPro
- Retirement Income Workshop
- Sure-Fire Trading Systems (VectorVest, Inc.)
- Trading as a Business Workshop
- VectorVest 7 EOD
- VectorVest 7 RealTime/IntraDay
- VectorVest AutoTester
- VectorVest Educational Services
- VectorVest OnLine
- VectorVest Options Analyzer
- VectorVest ProGraphics v6.0
- VectorVest ProTrader 7
- VectorVest RealTime Derby Tool
- VectorVest Simulator
- VectorVest Variator
- VectorVest Watchdog
