HOT TOPICS LIST
- MACD
- Fibonacci
- RSI
- Gann
- ADXR
- Stochastics
- Volume
- Triangles
- Futures
- Cycles
- Volatility
- ZIGZAG
- MESA
- Retracement
- Aroon
INDICATORS LIST
LIST OF TOPICS
PRINT THIS ARTICLE
by Koos van der Merwe
At the height of the tech boom, a stalwart of technical analysis, Gail Dudack, stated in a CNBC interview that Cisco Systems was her best indicator as to the direction of the technology market sector. Whether this is still true today, is a matter of perspective. However, here is a report on Cisco.
Position: Buy
Koos van der Merwe
Has been a technical analyst since 1969, and has worked as a futures and options trader with First Financial Futures in Johannesburg, South Africa.
PRINT THIS ARTICLE
MOVING AVERAGES
Cisco Systems
02/20/03 11:58:30 AMby Koos van der Merwe
At the height of the tech boom, a stalwart of technical analysis, Gail Dudack, stated in a CNBC interview that Cisco Systems was her best indicator as to the direction of the technology market sector. Whether this is still true today, is a matter of perspective. However, here is a report on Cisco.
Position: Buy
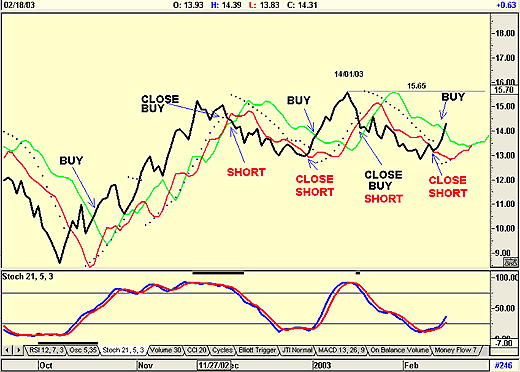
| The Red/Green strategy, introduced to readers on September 30th, 2002, has given a buy signal. As you can see from the chart below, the strategy has been quite successful in trading Cisco Systems. |
| To determine just how profitable the strategy is I ran a test using the program Technifilter Plus. I tested the strategy from January 1st, 2000 using a break above the green moving average line, a 2-day simple moving average of the high with a forward offset of 10 days, as the close short/open long signal, and the red line, a 2-day simple moving average of the low offset forward by six days, as the close long/enter short signal. Over the period, there were 76 trades, of which 50 were profitable giving a return for the period of 276%. |

|
| Cisco Systems - A good trade. |
| Graphic provided by: AdvancedGET. |
| |
| The strategy could be fine tuned further by including a parabolic indicator to close a position earlier, or by using a stop-loss strategy to reduces losses. Do note on the chart that the buy signal given has been confirmed by both the stochastic indicator (my preference is a 21,5,3 stochastic), and the parabolic SAR (stop and reverse) indicator. I am not that happy with the parabolic SAR indicator as a trading strategy on its own because it is inclined to whipsaw, but as a stop-loss indicator when in doubt, it can be quite useful. |
| My target is the resistance level at $15.65, the high point reached on January 14, 2003. A point and figure horizontal count (not shown) gives a target of $16.30. Buying at the current price of $14.31 with a 10% stop-loss, equals $1.43. Using a 2.5:1 profit to loss ratio, I would look for a profit of $3.58. The current price of $14.31 + $3.58 = $17.88, higher than the target I have estimated. |
| I would therefore look at Cisco Systems as a stock that should not be purchased for a long term hold - not yet anyway. |
Has been a technical analyst since 1969, and has worked as a futures and options trader with First Financial Futures in Johannesburg, South Africa.
| Address: | 3256 West 24th Ave |
| Vancouver, BC | |
| Phone # for sales: | 6042634214 |
| E-mail address: | petroosp@gmail.com |
Click here for more information about our publications!
Comments
Date: 02/25/03Rank: Comment: hi
i don t understand how you practice simple moving average ..could you please explain me...
thanks help

Request Information From Our Sponsors
- VectorVest, Inc.
- Executive Premier Workshop
- One-Day Options Course
- OptionsPro
- Retirement Income Workshop
- Sure-Fire Trading Systems (VectorVest, Inc.)
- Trading as a Business Workshop
- VectorVest 7 EOD
- VectorVest 7 RealTime/IntraDay
- VectorVest AutoTester
- VectorVest Educational Services
- VectorVest OnLine
- VectorVest Options Analyzer
- VectorVest ProGraphics v6.0
- VectorVest ProTrader 7
- VectorVest RealTime Derby Tool
- VectorVest Simulator
- VectorVest Variator
- VectorVest Watchdog
- StockCharts.com, Inc.
- Candle Patterns
- Candlestick Charting Explained
- Intermarket Technical Analysis
- John Murphy on Chart Analysis
- John Murphy's Chart Pattern Recognition
- John Murphy's Market Message
- MurphyExplainsMarketAnalysis-Intermarket Analysis
- MurphyExplainsMarketAnalysis-Visual Analysis
- StockCharts.com
- Technical Analysis of the Financial Markets
- The Visual Investor
