HOT TOPICS LIST
- MACD
- Fibonacci
- RSI
- Gann
- ADXR
- Stochastics
- Volume
- Triangles
- Futures
- Cycles
- Volatility
- ZIGZAG
- MESA
- Retracement
- Aroon
INDICATORS LIST
LIST OF TOPICS
PRINT THIS ARTICLE
by Gary Grosschadl
With the markets looking to make a possible reversal, this General Electric Co. (GE) chart looks like a good time to try a double bottom attempt.
Position: Buy
Gary Grosschadl
Independent Canadian equities trader and technical analyst based in Peterborough
Ontario, Canada.
PRINT THIS ARTICLE
DOUBLE BOTTOMS
General Electric Double Bottom Attempt Could Be Tradable
02/18/03 12:40:44 PMby Gary Grosschadl
With the markets looking to make a possible reversal, this General Electric Co. (GE) chart looks like a good time to try a double bottom attempt.
Position: Buy
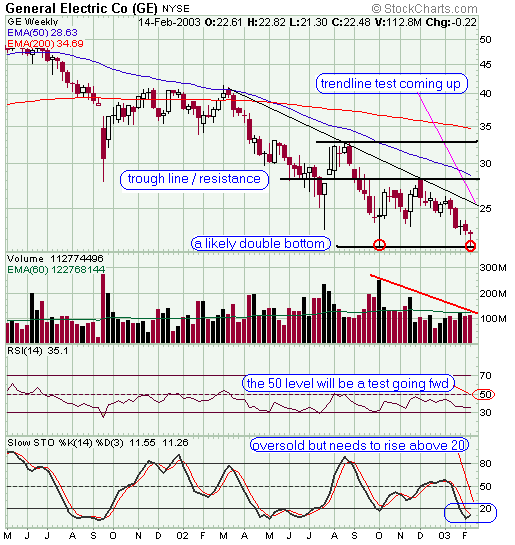
| Double bottoms usually take longer to form than double tops and normally should cover at least four weeks. In this case there is a healthy 18 weeks between bottoms. The pattern is not considered confirmed until the trough line resistance is broken and we are far from that $28 point. So this is a very early call...safer to qualify it as a double bottom attempt. By getting in this early you have to mitigate the risk with a reasonable stop-loss should the attempt fail. However a good profit opportunity presents itself even if this turns out to be a failure move to the trough line or close to it. The bottoms are marked by long legged doji candlesticks similar to hammers with those long lower shadows. Dojis often mark significant bottoms provided that they are confirmed the next period with an upward price move. The volume profile is correct here. The volume at the second bottom is considerably less than the previous bottom. This is important as it shows the bears have diminished strength here, with selling power drying up. Ideally the volume off the second trough should be higher than the first as signs of buying pressure increase. Note the trendline resistance that might be encountered very near $25-- this could be a trading target for many. |

|
| Figure 1: Weekly chart of GE. |
| Graphic provided by: StockCharts.com. |
| |
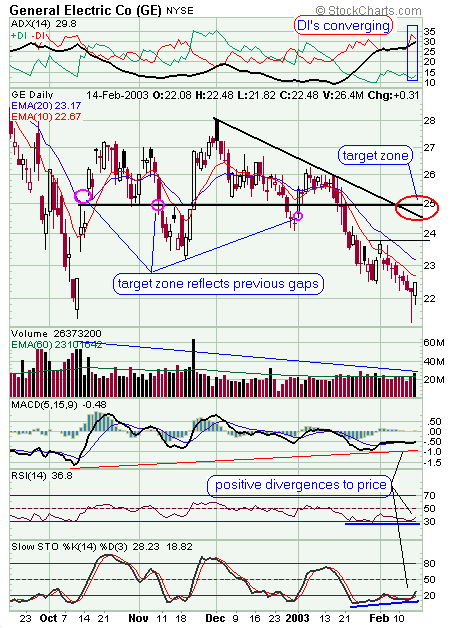
Traders considering entry here would consult the daily chart. The chart shows a hammer bottom with confirmation on the next trading day. The only caveat here is that the volume on the hammer was not exceptional...only average but as mentioned above, lower volume is expected relative to the previous bottom. Figure 2: Daily chart of GE. On the daily chart, additional indicators support the bullish upside arguments. The directional movement indicator above the chart shows the DIs just starting to converge and this is relevent as bullish power (+DI) should rise as bearish power (-DI) weakens. The lower indicators all show positive divergence as they refused to follow the recent price dip down. This is often a reliable signal pointing to additional upside potential. |
| The strategy for aggressive traders with a higher risk profile would be a stop-buy at just above Friday's high of 22.48-- make it 22.51. A small gap is permissible, a large gap too risky. A suggested initial stop-loss is at 21.79 which should be raised as a trailing stop as prices escalate. The suggested target zone is 24.50 to 25. Possible stall danger is between 20-day EMA 23.17 and 23.80. The daily closing candlestick patterns can also seve as a guide. These are short-term trading targets. Longer term traders may decide to ride out periods of consolidation/retracement (with suitable stop-loss points) as they wait for an additional upside leg, perhaps even fulfillment of the potential double bottom pattern. |
Independent Canadian equities trader and technical analyst based in Peterborough
Ontario, Canada.
| Website: | www.whatsonsale.ca/financial.html |
| E-mail address: | gwg7@sympatico.ca |
Click here for more information about our publications!
Comments
Date: 02/25/03Rank: 5Comment:
Date: 03/01/03Rank: 5Comment:

|

Request Information From Our Sponsors
- VectorVest, Inc.
- Executive Premier Workshop
- One-Day Options Course
- OptionsPro
- Retirement Income Workshop
- Sure-Fire Trading Systems (VectorVest, Inc.)
- Trading as a Business Workshop
- VectorVest 7 EOD
- VectorVest 7 RealTime/IntraDay
- VectorVest AutoTester
- VectorVest Educational Services
- VectorVest OnLine
- VectorVest Options Analyzer
- VectorVest ProGraphics v6.0
- VectorVest ProTrader 7
- VectorVest RealTime Derby Tool
- VectorVest Simulator
- VectorVest Variator
- VectorVest Watchdog
- StockCharts.com, Inc.
- Candle Patterns
- Candlestick Charting Explained
- Intermarket Technical Analysis
- John Murphy on Chart Analysis
- John Murphy's Chart Pattern Recognition
- John Murphy's Market Message
- MurphyExplainsMarketAnalysis-Intermarket Analysis
- MurphyExplainsMarketAnalysis-Visual Analysis
- StockCharts.com
- Technical Analysis of the Financial Markets
- The Visual Investor
