HOT TOPICS LIST
- MACD
- Fibonacci
- RSI
- Gann
- ADXR
- Stochastics
- Volume
- Triangles
- Futures
- Cycles
- Volatility
- ZIGZAG
- MESA
- Retracement
- Aroon
INDICATORS LIST
LIST OF TOPICS
PRINT THIS ARTICLE
by Koos van der Merwe
LookSmart (LOOK) is a search engine that is one of the few Internet companies that are showing a profit. Their price has moved up strongly from $0.79 in October to above $3.00 today. Is it worth buying?
Position: Sell
Koos van der Merwe
Has been a technical analyst since 1969, and has worked as a futures and options trader with First Financial Futures in Johannesburg, South Africa.
PRINT THIS ARTICLE
CHART ANALYSIS
A Look at LOOK's Complex Chart Pattern
02/13/03 12:09:21 PMby Koos van der Merwe
LookSmart (LOOK) is a search engine that is one of the few Internet companies that are showing a profit. Their price has moved up strongly from $0.79 in October to above $3.00 today. Is it worth buying?
Position: Sell
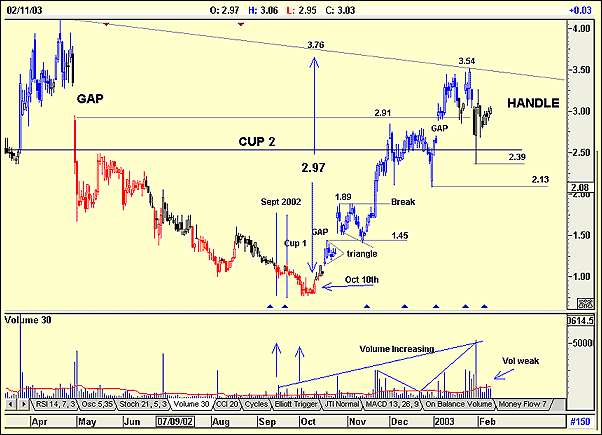
| A look at the chart below shows how LOOKs price gapped down in April 2002 and on strong volume. The price continued to fall on below average volume, with the occasional volume spike as the price fell further. |
| In September 2002, the price had a small consolidation on volume that was above average. The price also started falling on below average volume, suggesting that sellers were drying up. But there was still nothing to get excited about. |

|
| A look at LookSmart. |
| Graphic provided by: AdvancedGET. |
| |
| On October 10th, the price started moving up strongly, on volume that was slightly higher than average. This lasted til the 18th of October, when the price paused in consolidation. Watchers of the share would have been aware of the triangle that formed, and been buyers, probably the reason why the share price gapped up on strong volume, reaching a high of $1.89. That consolidation triangle could also have been taken to be a handle of the small cup (cup 1) that had formed. |
| The price then traded in the range $1.45, the start of the gap, and $1.89, forming an unstable broadening formation, but finding strong support at $1.49. It then broke through $1.89 on very strong volume, finding resistance once again at $2.91, the lower boundary of a gap, this time the larger gap of April 2002. Once again it formed a consolidation pattern around $2.91 before gapping up through the resistance level topping out at $3.54. The question now is this. Is the present consolidation, which is very volatile, and moving down on high volume, the start of a new handle in a very large cup and handle formation? As shown on the chart, volume has been increasing steadily, with weaker than average volume occurring over consolidation period, and on any sell offs. I have shown on the chart that a price above $3.54 could be a good level to buy the stock. The upward price movement over the last few days, has been on below average volume, which is a sign of weakness, so it is very possible that the price could look to test the support level at $2.39 or $2.13 before moving up. |
| LookSmart is a share to watch, but only a buy if it breaks above the $3.54 resistance level. Its target as determined by the cup and handle pattern would be $6.73 and is calculated as follows. The cup bottomed at $0.79, and the upper trendline is $3.76. The difference is $2.97 which added to $3.76 equals $6.73. |
Has been a technical analyst since 1969, and has worked as a futures and options trader with First Financial Futures in Johannesburg, South Africa.
| Address: | 3256 West 24th Ave |
| Vancouver, BC | |
| Phone # for sales: | 6042634214 |
| E-mail address: | petroosp@gmail.com |
Click here for more information about our publications!
PRINT THIS ARTICLE

Request Information From Our Sponsors
- StockCharts.com, Inc.
- Candle Patterns
- Candlestick Charting Explained
- Intermarket Technical Analysis
- John Murphy on Chart Analysis
- John Murphy's Chart Pattern Recognition
- John Murphy's Market Message
- MurphyExplainsMarketAnalysis-Intermarket Analysis
- MurphyExplainsMarketAnalysis-Visual Analysis
- StockCharts.com
- Technical Analysis of the Financial Markets
- The Visual Investor
- VectorVest, Inc.
- Executive Premier Workshop
- One-Day Options Course
- OptionsPro
- Retirement Income Workshop
- Sure-Fire Trading Systems (VectorVest, Inc.)
- Trading as a Business Workshop
- VectorVest 7 EOD
- VectorVest 7 RealTime/IntraDay
- VectorVest AutoTester
- VectorVest Educational Services
- VectorVest OnLine
- VectorVest Options Analyzer
- VectorVest ProGraphics v6.0
- VectorVest ProTrader 7
- VectorVest RealTime Derby Tool
- VectorVest Simulator
- VectorVest Variator
- VectorVest Watchdog
