HOT TOPICS LIST
- MACD
- Fibonacci
- RSI
- Gann
- ADXR
- Stochastics
- Volume
- Triangles
- Futures
- Cycles
- Volatility
- ZIGZAG
- MESA
- Retracement
- Aroon
INDICATORS LIST
LIST OF TOPICS
PRINT THIS ARTICLE
by Gary Grosschadl
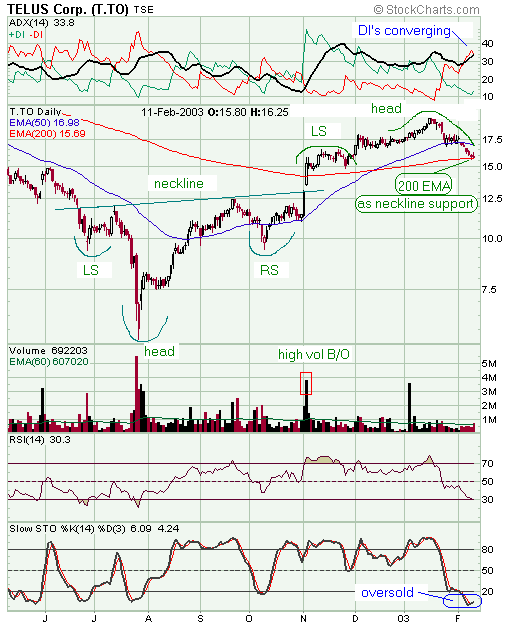
It is too early to call a head and shoulders top, but the placement of the usually relevant 200-period EMA (exponential moving average) makes this a distinct possibility going forward. In the meantime, traders may be able to position themselves for a possible bounce at what is likely to be the start of the right shoulder.
Position: N/A
Gary Grosschadl
Independent Canadian equities trader and technical analyst based in Peterborough
Ontario, Canada.
PRINT THIS ARTICLE
HEAD & SHOULDERS
Telus Corp. May Be Building Another Head & Shoulders Pattern
02/13/03 09:07:10 AMby Gary Grosschadl
It is too early to call a head and shoulders top, but the placement of the usually relevant 200-period EMA (exponential moving average) makes this a distinct possibility going forward. In the meantime, traders may be able to position themselves for a possible bounce at what is likely to be the start of the right shoulder.
Position: N/A
| Traders need to see the stock move off this moving average in the next day or two to make this a more convincing play. Should it fail here at the 200-period EMA, more downside is possible but since the stochastics are already in an oversold situation, a bounce here is more likely. Previous congestion at the $18 level could be a target to watch. |
| Another clue of a possible bounce here is given by the directional movement indicator (DMI) on top of the chart. The DIs are just starting to converge and if this continues bearish power will wane at the same time bullish power rises. A bullish price surge here could bring these lines close to a reversal, shifting power from the bears to the bulls. Even if these lines do not manage to actually cross, they are sufficiently wide apart for the price to surge upwards before any possible DI stall (refusal to cross). The nearby 50-period EMA line should also be watched for signs of an early stall, should the stock balk at this $17 level. |

|
| Graphic provided by: stockcharts.com. |
| |
| Traders not interested in chasing a potentially smaller move here should wait for what may become a larger head and shoulder failure down the road. If this transpires, it should occur at a support break of the 200-period EMA, likely acting as the neckline support. A large volume signal as this important support line gives way would be a good trading signal once the right shoulder has finished forming. |
| A previous head and shoulders reversal pattern shows a classic large volume thrust through the neckline. Looking at those shoulder formations gives a feel for what could be occurring now as this new right shoulder formation may be on the verge of starting. So traders have two possible plays should this head and shoulder formation come to pass. Go long on the start of the right shoulder and/or go short once the pattern proves itself further with a return to neckline and a subsequent failure. The latter play would be more suitable to those traders wanting to trade the "elephant tracks" - a bigger signal on bigger volume. |
Independent Canadian equities trader and technical analyst based in Peterborough
Ontario, Canada.
| Website: | www.whatsonsale.ca/financial.html |
| E-mail address: | gwg7@sympatico.ca |
Click here for more information about our publications!
PRINT THIS ARTICLE

Request Information From Our Sponsors
- StockCharts.com, Inc.
- Candle Patterns
- Candlestick Charting Explained
- Intermarket Technical Analysis
- John Murphy on Chart Analysis
- John Murphy's Chart Pattern Recognition
- John Murphy's Market Message
- MurphyExplainsMarketAnalysis-Intermarket Analysis
- MurphyExplainsMarketAnalysis-Visual Analysis
- StockCharts.com
- Technical Analysis of the Financial Markets
- The Visual Investor
- VectorVest, Inc.
- Executive Premier Workshop
- One-Day Options Course
- OptionsPro
- Retirement Income Workshop
- Sure-Fire Trading Systems (VectorVest, Inc.)
- Trading as a Business Workshop
- VectorVest 7 EOD
- VectorVest 7 RealTime/IntraDay
- VectorVest AutoTester
- VectorVest Educational Services
- VectorVest OnLine
- VectorVest Options Analyzer
- VectorVest ProGraphics v6.0
- VectorVest ProTrader 7
- VectorVest RealTime Derby Tool
- VectorVest Simulator
- VectorVest Variator
- VectorVest Watchdog
