HOT TOPICS LIST
- MACD
- Fibonacci
- RSI
- Gann
- ADXR
- Stochastics
- Volume
- Triangles
- Futures
- Cycles
- Volatility
- ZIGZAG
- MESA
- Retracement
- Aroon
INDICATORS LIST
LIST OF TOPICS
PRINT THIS ARTICLE
by Kevin Hopson
Spinnaker Exploration (SKE) continues to be stuck in a long-term downtrend. Given the recent break of support at the $20.00 level and weakening technicals, the stock is still on course to hit new lows.
Position: Sell
Kevin Hopson
Kevin has been a technical analyst for roughly 10 years now. Previously, Kevin owned his own business and acted as a registered investment advisor, specializing in energy. He was also a freelance oil analyst for Orient Trading Co., a commodity futures trading firm in Japan. Kevin is currently a freelance writer.
PRINT THIS ARTICLE
TECHNICAL ANALYSIS
Spinnaker Exploration Still Looks Poised For New Lows
02/10/03 01:39:59 PMby Kevin Hopson
Spinnaker Exploration (SKE) continues to be stuck in a long-term downtrend. Given the recent break of support at the $20.00 level and weakening technicals, the stock is still on course to hit new lows.
Position: Sell
| I touched on Spinnaker Exploration (SKE) a couple of weeks ago. More specifically, I mentioned how Elliott Wave theory indicated a potential move to new lows in the near future. According to the chart, this still looks to be the case with the stock. |
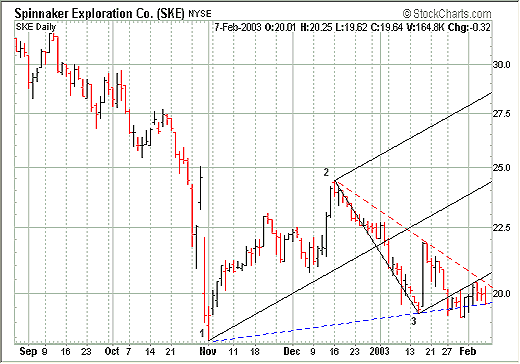
| For example, in my prior article, I mentioned that the stock's inability to test the median line (middle line) of the black pitchfork indicated weakness and would likely lead to a break of support at the $20.00 level - or the bottom parallel line. As you can see, this theory held true. Normally, when the price breaks the lower parallel line of a pitchfork after failing to test the median line, the stock will return - at minimal - to the point of the third pivot. Looking at the chart, you will notice that this occurred and the stock actually moved below this pivot price (roughly $19.50). |

|
| Graphic provided by: StockCharts.com. |
| |
| You will also notice that the stock initially broke below the dotted blue line, which was another warning signal. This line is drawn from the first pivot of the pitchfork to the third pivot and then extended. When prices broke below this line, the stock gave another short-term sell signal. Though Spinnaker has since moved back above this line and is currently finding support along it, notice how the stock has been finding resistance along the bottom parallel line of the pitchfork. |
| Additionally, December's downtrend line (dotted red line) is now coming into play, which should strengthen the resistance at current levels. Also, if you were to draw a line from the November low to the recent lows (which I did not do due to the proximity of the dotted blue line), one could come to the conclusion that the stock is forming a large triangle. Since this tends to be a continuation pattern and the long-term trend is down, I would expect a break to the downside. |
| However, it should be noted that triangle formations tend to be the launching point for the final leg of a trend, whether it be an uptrend or a downtrend. Since I believe (see my prior article) that Spinnaker is in the fifth wave of a five-wave downtrend, this would support my theory that the stock will hit new lows and then begin a longer-term uptrend. Since this would be the opportune time to buy, I will provide an update when the stock looks to have completed its current downtrend. |
Kevin has been a technical analyst for roughly 10 years now. Previously, Kevin owned his own business and acted as a registered investment advisor, specializing in energy. He was also a freelance oil analyst for Orient Trading Co., a commodity futures trading firm in Japan. Kevin is currently a freelance writer.
| Glen Allen, VA | |
| E-mail address: | hopson_1@yahoo.com |
Click here for more information about our publications!
Comments
Date: 02/10/03Rank: 4Comment:
Date: 02/12/03Rank: 5Comment:

|

Request Information From Our Sponsors
- VectorVest, Inc.
- Executive Premier Workshop
- One-Day Options Course
- OptionsPro
- Retirement Income Workshop
- Sure-Fire Trading Systems (VectorVest, Inc.)
- Trading as a Business Workshop
- VectorVest 7 EOD
- VectorVest 7 RealTime/IntraDay
- VectorVest AutoTester
- VectorVest Educational Services
- VectorVest OnLine
- VectorVest Options Analyzer
- VectorVest ProGraphics v6.0
- VectorVest ProTrader 7
- VectorVest RealTime Derby Tool
- VectorVest Simulator
- VectorVest Variator
- VectorVest Watchdog
- StockCharts.com, Inc.
- Candle Patterns
- Candlestick Charting Explained
- Intermarket Technical Analysis
- John Murphy on Chart Analysis
- John Murphy's Chart Pattern Recognition
- John Murphy's Market Message
- MurphyExplainsMarketAnalysis-Intermarket Analysis
- MurphyExplainsMarketAnalysis-Visual Analysis
- StockCharts.com
- Technical Analysis of the Financial Markets
- The Visual Investor
