HOT TOPICS LIST
- MACD
- Fibonacci
- RSI
- Gann
- ADXR
- Stochastics
- Volume
- Triangles
- Futures
- Cycles
- Volatility
- ZIGZAG
- MESA
- Retracement
- Aroon
INDICATORS LIST
LIST OF TOPICS
PRINT THIS ARTICLE
by Jason K. Hutson
Bollinger Bands can give you the advantage of having a statistical perspective on trading.
Position: Hold
Jason K. Hutson
Traders.com Staff Writer. Enjoys trendlines, support and resistance, moving averages, RSI, MACD, ADX, Bollinger bands, parabolic SAR, chart formations, and volume analysis.
PRINT THIS ARTICLE
BOLLINGER BANDS
Bollinger Bands
06/01/00 02:05:02 PMby Jason K. Hutson
Bollinger Bands can give you the advantage of having a statistical perspective on trading.
Position: Hold
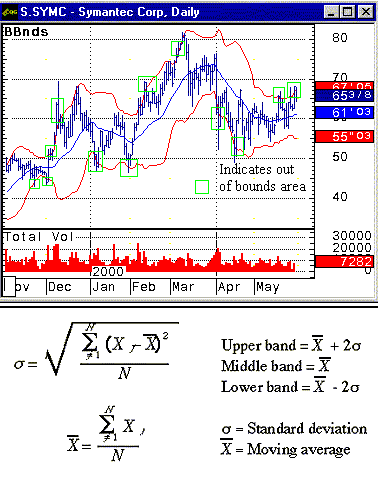
| Bollinger Bands, named after market analyst John Bollinger, are a type of trading band indicator that use the standard deviations of a moving average to show a security's trading range. The bands consist of three plotted lines, the middle being a moving average, the upper band being two standard deviations added on to the moving average, and the lower band being two standard deviations subtracted from the moving average. Ninety-eight percent of a security's prices should fall within the band's range. Where any given price falls relative to the bands will indicate whether that security is trading relatively high or low. To determine the Bollinger Bands' limits, first calculate the typical price, which is the high, low and close summed and divided by three. Then calculate the 20-day simple moving average. Next, the standard deviation of the typical price over the 20-day period is calculated. The upper Bollinger Band is the 20-day moving average plus two standard deviations. The middle band is the 20-day simple moving average. The lower band is the 20-day simple moving average minus two standard deviations. |
| A simple moving average gives the general direction of a security's price, the current price compared to the average, and also filters out noisy data. Statistically an average is a small clue describing a total poplulation of data. You can help describe the security in more depth if you understand how to use the standard deviation along with an average. For example: If a security's price average is $50, and its standard deviation is $10, then: 68% of all values will be between $60 and $40, and 96% of all values (+/- two standard deviations from the average), will be between $70 and $30. |

|
| Symantec Corporation (SYMC) has stepped out of its Bollinger Band bounds. This security most likely will retrace to a $60 or lower price level. At that time it may be a less risky buy opportunity. |
| Graphic provided by: CQG. |
| |
| The standard deviation can can help you analyze the following: 1. Out of bounds data - Data that is likely to be out of bounds will be outside the Bollinger Band limits. Whenever the security price is outside those limits it is implied statistically that the price will only stay outside those upper or lower limits 4% of the time. 2. Security volatility - The larger the standard deviation the higher the volatility. 3. The begining or end of a trend and order execution levels - In some cases the price level may move from one limit end of a Bollinger Band to another showing a possible trend reversal and a possible place to put a buy order, sell order, or sell short order. |
Traders.com Staff Writer. Enjoys trendlines, support and resistance, moving averages, RSI, MACD, ADX, Bollinger bands, parabolic SAR, chart formations, and volume analysis.
| Title: | Industrial Engineer |
| Company: | Technical Analysis, Inc. |
| Address: | 4757 California Ave SW |
| Seattle, WA 98116 | |
| Phone # for sales: | 206 938 0570 |
| Website: | Traders.com |
| E-mail address: | JasonHutson@Traders.com |
Traders' Resource Links | |
| Charting the Stock Market: The Wyckoff Method -- Books | |
| Working-Money.com -- Online Trading Services | |
| Traders.com Advantage -- Online Trading Services | |
| Technical Analysis of Stocks & Commodities -- Publications and Newsletters | |
| Working Money, at Working-Money.com -- Publications and Newsletters | |
| Traders.com Advantage -- Publications and Newsletters | |
| Professional Traders Starter Kit -- Software | |
Click here for more information about our publications!
Comments
Date: / /Rank: 2Comment:
Date: / /Rank: 1Comment: dont care about the mathematics of the thing just how to use it in real life. only pedantics are concerned about that not real traders
Date: 06/27/01Rank: 3Comment:

Request Information From Our Sponsors
- StockCharts.com, Inc.
- Candle Patterns
- Candlestick Charting Explained
- Intermarket Technical Analysis
- John Murphy on Chart Analysis
- John Murphy's Chart Pattern Recognition
- John Murphy's Market Message
- MurphyExplainsMarketAnalysis-Intermarket Analysis
- MurphyExplainsMarketAnalysis-Visual Analysis
- StockCharts.com
- Technical Analysis of the Financial Markets
- The Visual Investor
- VectorVest, Inc.
- Executive Premier Workshop
- One-Day Options Course
- OptionsPro
- Retirement Income Workshop
- Sure-Fire Trading Systems (VectorVest, Inc.)
- Trading as a Business Workshop
- VectorVest 7 EOD
- VectorVest 7 RealTime/IntraDay
- VectorVest AutoTester
- VectorVest Educational Services
- VectorVest OnLine
- VectorVest Options Analyzer
- VectorVest ProGraphics v6.0
- VectorVest ProTrader 7
- VectorVest RealTime Derby Tool
- VectorVest Simulator
- VectorVest Variator
- VectorVest Watchdog
