HOT TOPICS LIST
- MACD
- Fibonacci
- RSI
- Gann
- ADXR
- Stochastics
- Volume
- Triangles
- Futures
- Cycles
- Volatility
- ZIGZAG
- MESA
- Retracement
- Aroon
INDICATORS LIST
LIST OF TOPICS
PRINT THIS ARTICLE
by Gary Grosschadl
A previous pattern has come into play again as this index tries for another bounce up via the recent bottom hammer.
Position: N/A
Gary Grosschadl
Independent Canadian equities trader and technical analyst based in Peterborough
Ontario, Canada.
PRINT THIS ARTICLE
CHART ANALYSIS
Airline Index Testing a Bottom Hammer
02/07/03 12:26:28 PMby Gary Grosschadl
A previous pattern has come into play again as this index tries for another bounce up via the recent bottom hammer.
Position: N/A
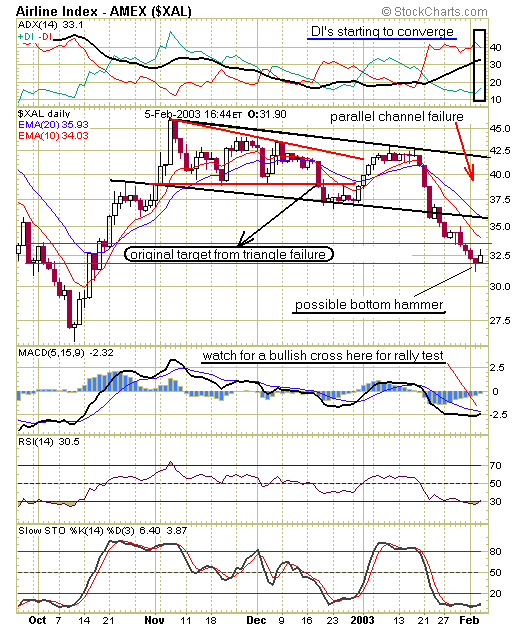
| In my previous article, "Airline Index In Descent" (Traders.com Advantage,12/19/02), I discussed the possibility of a bearish decline via a descending triangle breakdown, via the red trendlines shown on the chart below. The decline was short-lived as XAL regrouped at a former congestion level in late October. The next stochastic upleg had the index rise but it fell short of previous highs. A swift decline followed, forewarned by a bearish crossover of DIs in the ADX indicator graph. |
| Now, armed with additional data points, I have drawn a bearish channel, shown by the black trendlines on the chart below. The failure below this channel has led to further declines. Now a bottom may be forming at precisely the same level of the original bottom target forecast by the measurement of the descending triangle failure. The placement of the bottom hammer here at the original target from triangle failure lends credence to a bounce. |

|
| Graphic provided by: stockcharts.com. |
| |
| Now the question going forward is: Will this be just another bear rally bounce destined for failure? The answer may come at the test of that bottom channel trendline which also happens to be the 20-period EMA resistance line. A successful test could lead to a challenge of the top channel trendline and this would imply a bold move upwards. Watch the first test carefully, it could be a turning point for this sector and the stocks that mirror it. |
| The chart lesson here includes looking at previous patterns for clues that they are being fulfilled in an albeit, roundabout way. When the coming test at lower trendline occurs, watch for a possible MACD stall at the zero line and whether or not the DIs manage to cross (or be rejected) as clues going forward. |
Independent Canadian equities trader and technical analyst based in Peterborough
Ontario, Canada.
| Website: | www.whatsonsale.ca/financial.html |
| E-mail address: | gwg7@sympatico.ca |
Click here for more information about our publications!
Comments
Date: 02/12/03Rank: 5Comment:

Request Information From Our Sponsors
- StockCharts.com, Inc.
- Candle Patterns
- Candlestick Charting Explained
- Intermarket Technical Analysis
- John Murphy on Chart Analysis
- John Murphy's Chart Pattern Recognition
- John Murphy's Market Message
- MurphyExplainsMarketAnalysis-Intermarket Analysis
- MurphyExplainsMarketAnalysis-Visual Analysis
- StockCharts.com
- Technical Analysis of the Financial Markets
- The Visual Investor
- VectorVest, Inc.
- Executive Premier Workshop
- One-Day Options Course
- OptionsPro
- Retirement Income Workshop
- Sure-Fire Trading Systems (VectorVest, Inc.)
- Trading as a Business Workshop
- VectorVest 7 EOD
- VectorVest 7 RealTime/IntraDay
- VectorVest AutoTester
- VectorVest Educational Services
- VectorVest OnLine
- VectorVest Options Analyzer
- VectorVest ProGraphics v6.0
- VectorVest ProTrader 7
- VectorVest RealTime Derby Tool
- VectorVest Simulator
- VectorVest Variator
- VectorVest Watchdog
