HOT TOPICS LIST
- MACD
- Fibonacci
- RSI
- Gann
- ADXR
- Stochastics
- Volume
- Triangles
- Futures
- Cycles
- Volatility
- ZIGZAG
- MESA
- Retracement
- Aroon
INDICATORS LIST
LIST OF TOPICS
PRINT THIS ARTICLE
by Dennis D. Peterson
A descending right triangle seems to have formed.
Position: N/A
Dennis D. Peterson
Market index trading on a daily basis.
PRINT THIS ARTICLE
DESCENDING TRIANGLES
Which Way Is The Nasdaq Headed?
02/06/03 09:50:46 AMby Dennis D. Peterson
A descending right triangle seems to have formed.
Position: N/A
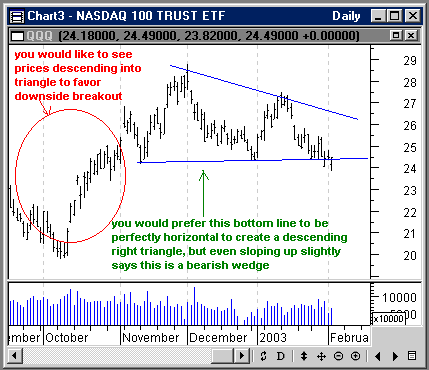
| Right triangles are one of the more reliable patterns. Looking at daily data for QQQ you see a price pattern closely resembling a descending right triangle (Figure 1). |

|
| Figure 1: Daily QQQ Price And Volume. Trendlines drawn along the peaks and valleys of recent price history nearly forms a descending right triangle. |
| Graphic provided by: MetaStock. |
| Graphic provided by: Data Vendor: eSignal. |
| |
| The price pattern is only close to a descending right triangle because the bottom trendline is not perfectly horizontal; however, with an upsloping bottom trendline the pattern forms a bearish wedge. Either way, wedge or triangle, the pattern favors bears and shorts. Does the Nasdaq composite say anything different? |
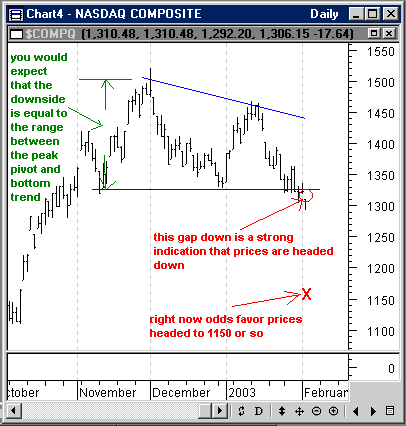
 Figure 2: Daily Nasdaq Composite Price. A gap down is a strong indication that the triangle base will be the target before a reversal is seen. Currently, 1150 is in play. The Nasdaq composite gives a clearer picture that we have descending right triangle and today's gap down only confirms a move down. Ideally prices would been coming down into the pattern. Nevertheless the odds favor shorts. VXN should confirm. |
Market index trading on a daily basis.
| Title: | Staff Writer |
| Company: | Technical Analysis, Inc. |
| Address: | 4757 California Ave SW |
| Seattle, WA 98116-4499 | |
| Phone # for sales: | 206 938 0570 |
| Fax: | 206 938 1307 |
| Website: | www.traders.com |
| E-mail address: | dpeterson@traders.com |
Traders' Resource Links | |
| Charting the Stock Market: The Wyckoff Method -- Books | |
| Working-Money.com -- Online Trading Services | |
| Traders.com Advantage -- Online Trading Services | |
| Technical Analysis of Stocks & Commodities -- Publications and Newsletters | |
| Working Money, at Working-Money.com -- Publications and Newsletters | |
| Traders.com Advantage -- Publications and Newsletters | |
| Professional Traders Starter Kit -- Software | |
Click here for more information about our publications!
PRINT THIS ARTICLE

Request Information From Our Sponsors
- StockCharts.com, Inc.
- Candle Patterns
- Candlestick Charting Explained
- Intermarket Technical Analysis
- John Murphy on Chart Analysis
- John Murphy's Chart Pattern Recognition
- John Murphy's Market Message
- MurphyExplainsMarketAnalysis-Intermarket Analysis
- MurphyExplainsMarketAnalysis-Visual Analysis
- StockCharts.com
- Technical Analysis of the Financial Markets
- The Visual Investor
- VectorVest, Inc.
- Executive Premier Workshop
- One-Day Options Course
- OptionsPro
- Retirement Income Workshop
- Sure-Fire Trading Systems (VectorVest, Inc.)
- Trading as a Business Workshop
- VectorVest 7 EOD
- VectorVest 7 RealTime/IntraDay
- VectorVest AutoTester
- VectorVest Educational Services
- VectorVest OnLine
- VectorVest Options Analyzer
- VectorVest ProGraphics v6.0
- VectorVest ProTrader 7
- VectorVest RealTime Derby Tool
- VectorVest Simulator
- VectorVest Variator
- VectorVest Watchdog
