HOT TOPICS LIST
- MACD
- Fibonacci
- RSI
- Gann
- ADXR
- Stochastics
- Volume
- Triangles
- Futures
- Cycles
- Volatility
- ZIGZAG
- MESA
- Retracement
- Aroon
INDICATORS LIST
LIST OF TOPICS
PRINT THIS ARTICLE
by Gary Grosschadl
Harley Davidson has had quite a ride but now the charts are suggesting share prices may be headed "down the highway."
Position: Sell
Gary Grosschadl
Independent Canadian equities trader and technical analyst based in Peterborough
Ontario, Canada.
PRINT THIS ARTICLE
CHART ANALYSIS
Is Harley Running Out of Gas?
02/05/03 10:14:49 AMby Gary Grosschadl
Harley Davidson has had quite a ride but now the charts are suggesting share prices may be headed "down the highway."
Position: Sell
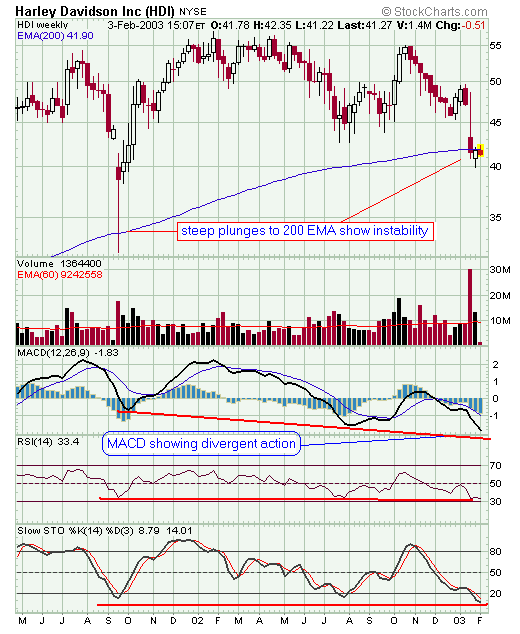
 Figure 1: Weekly chart of Harley Davidson, Inc. (HDI). As the weekly chart shows, HDI has been having rather violent price swings. These plunges are reflecting price instability. Checking with some of my regular indicators, the divergent action from the MACD (moving averge convergence/divergence) seems to be warning that price will deteriorate further. |
| The weekly chart makes it difficult to see if this is indeed topping action in the longer term, so a look at the monthy chart for further clarification is warranted. |

|
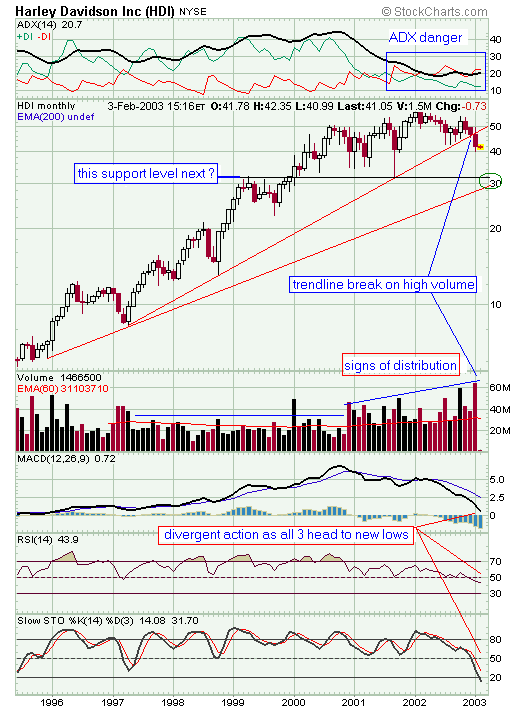
| Figure 2: Monthly chart of Harley Davidson. |
| Graphic provided by: StockCharts.com. |
| |
| Here we see things more clearly, and for shareholders this is a heads up as things are looking dangerous. An eight year trendline has broken to the downside on large volume. Also the overall volume pattern should be ringing alarm bells as we are seeing a distribution (selling by big money) phase at what now appears as a overall topping trend in this long-term view. A trend of increasing volume while shares do not climb higher or start to stumble in any time frame, is a sign that smart money is leaving and you should consider same. |
| The displayed indicators are also singing a nasty song. The ADX trend on top of the monthly chart clearly shows a significant change via selling power (-DI) taking control over buying power (+DI). Also note that the three lower indicators are pointing to new low areas seemingly ahead of price action. |
| It's been a great ride for long-term shareholders but I wouldn't be hanging on to the Harley unless you are looking for adventure of the wrong kind. A move to the $30 support level is likely and failure there will attract short sellers. |
Independent Canadian equities trader and technical analyst based in Peterborough
Ontario, Canada.
| Website: | www.whatsonsale.ca/financial.html |
| E-mail address: | gwg7@sympatico.ca |
Click here for more information about our publications!
Comments

Request Information From Our Sponsors
- StockCharts.com, Inc.
- Candle Patterns
- Candlestick Charting Explained
- Intermarket Technical Analysis
- John Murphy on Chart Analysis
- John Murphy's Chart Pattern Recognition
- John Murphy's Market Message
- MurphyExplainsMarketAnalysis-Intermarket Analysis
- MurphyExplainsMarketAnalysis-Visual Analysis
- StockCharts.com
- Technical Analysis of the Financial Markets
- The Visual Investor
- VectorVest, Inc.
- Executive Premier Workshop
- One-Day Options Course
- OptionsPro
- Retirement Income Workshop
- Sure-Fire Trading Systems (VectorVest, Inc.)
- Trading as a Business Workshop
- VectorVest 7 EOD
- VectorVest 7 RealTime/IntraDay
- VectorVest AutoTester
- VectorVest Educational Services
- VectorVest OnLine
- VectorVest Options Analyzer
- VectorVest ProGraphics v6.0
- VectorVest ProTrader 7
- VectorVest RealTime Derby Tool
- VectorVest Simulator
- VectorVest Variator
- VectorVest Watchdog
