HOT TOPICS LIST
- MACD
- Fibonacci
- RSI
- Gann
- ADXR
- Stochastics
- Volume
- Triangles
- Futures
- Cycles
- Volatility
- ZIGZAG
- MESA
- Retracement
- Aroon
INDICATORS LIST
LIST OF TOPICS
PRINT THIS ARTICLE
by Kevin Hopson
Patterson-UTI Energy, Inc. (PTEN) had been stuck in a trading range most of January. Now that the stock has broken above the upper channel line, higher prices should prevail.
Position: Accumulate
Kevin Hopson
Kevin has been a technical analyst for roughly 10 years now. Previously, Kevin owned his own business and acted as a registered investment advisor, specializing in energy. He was also a freelance oil analyst for Orient Trading Co., a commodity futures trading firm in Japan. Kevin is currently a freelance writer.
PRINT THIS ARTICLE
TECHNICAL ANALYSIS
Patterson's Channel Breakout Indicates Higher Prices in the Near-Term
02/03/03 10:19:32 AMby Kevin Hopson
Patterson-UTI Energy, Inc. (PTEN) had been stuck in a trading range most of January. Now that the stock has broken above the upper channel line, higher prices should prevail.
Position: Accumulate
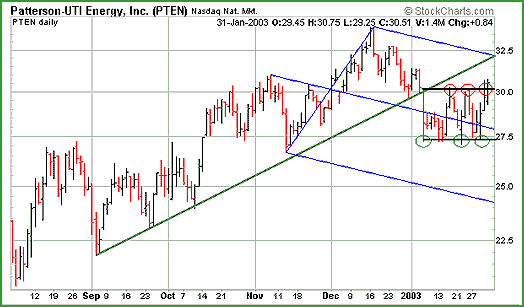
| Patterson-UTI Energy, Inc. (PTEN), an operator of land-based drilling rigs in Texas, New Mexico, Oklahoma, Louisiana, Mississippi, Utah and Western Canada, found itself stuck in a trading range most of last month. More specifically, the stock consolidated in the $27.00 to $30.00 range after topping out around the $34.00 level last December. Fortunately (for those investors who are long the stock), Patterson proceeded to break out of this channel on January 31. Given the short interest ratio of over 5.0x and the fact that half of the covering analysts currently have "Hold" ratings on the stock, Patterson has a significant amount of potential buying pressure to push it higher. |
| Based on the number of times that Patterson tested the upper channel line, the initial price target for the stock is $36.00. If you look at the chart, I will show you how to calculate this. First, notice how the stock first bottomed out around the $27.25 level, which acted as the lower channel line of the trading range. According to Dr. Andrews, who initially developed pitchfork and median line techniques for trading, price bars should be circled every time they touch the upper or lower channel line. However, this must occur in sequence, meaning that the price bar is only circled after it has touched the opposite channel line first. |

|
| Graphic provided by: StockCharts.com. |
| |
| For example, notice how the stock price tested the bottom channel line after the first green circle. This price bar would not be circled because the stock must first test the upper channel line before the lower channel line comes into play again. As you can see in the chart, the three red circles and three green circles represent this sequence. Keep this number (3) in mind, as it will determine the multiple for our price target. The second thing you calculate is the distance of the channel from top to bottom. Since the stock traded between the $27.25 and $30.25 levels, the channel range is $3.00. |
| Now take this number and multiply it by three, the number of times the stock tested the upper channel line (including the breakout). When you do this ($3.00 x 3), you come up with $9.00. To determine the first price target of the channel breakout, add this number to the bottom channel line ($27.25 + $9.00), which comes out to roughly $36.25. In the event that Patterson exceeds this price target down the road, you can calculate a second potential target. To do this, add $9.00 to the top channel line ($30.25 + $9.00), which gives a second price target of $39.25. Though nothing is for sure, you can expect Patterson to move up to the $36.00 to $39.00 range based on the recent channel breakout. |
| However, the stock will likely encounter resistance during the course of its breakout, should it - in fact - move higher. More specifically, notice the long-term uptrend line (green line) in the chart, which is converging around the $32.00 level. Because this trendline was broken in early January, it should now act as resistance. Also, notice the top parallel line of the blue pitchfork, which intersects with the stock's former uptrend line. Given the confluence of trendlines here, the $32.00 level could be a significant resistance point for the stock. If Patterson stays true to form, I would expect a pullback at this level before proceeding higher. |
Kevin has been a technical analyst for roughly 10 years now. Previously, Kevin owned his own business and acted as a registered investment advisor, specializing in energy. He was also a freelance oil analyst for Orient Trading Co., a commodity futures trading firm in Japan. Kevin is currently a freelance writer.
| Glen Allen, VA | |
| E-mail address: | hopson_1@yahoo.com |
Click here for more information about our publications!
Comments
Date: 02/04/03Rank: 4Comment:
Date: 02/04/03Rank: 5Comment:
Date: 02/20/03Rank: 5Comment:

Request Information From Our Sponsors
- StockCharts.com, Inc.
- Candle Patterns
- Candlestick Charting Explained
- Intermarket Technical Analysis
- John Murphy on Chart Analysis
- John Murphy's Chart Pattern Recognition
- John Murphy's Market Message
- MurphyExplainsMarketAnalysis-Intermarket Analysis
- MurphyExplainsMarketAnalysis-Visual Analysis
- StockCharts.com
- Technical Analysis of the Financial Markets
- The Visual Investor
- VectorVest, Inc.
- Executive Premier Workshop
- One-Day Options Course
- OptionsPro
- Retirement Income Workshop
- Sure-Fire Trading Systems (VectorVest, Inc.)
- Trading as a Business Workshop
- VectorVest 7 EOD
- VectorVest 7 RealTime/IntraDay
- VectorVest AutoTester
- VectorVest Educational Services
- VectorVest OnLine
- VectorVest Options Analyzer
- VectorVest ProGraphics v6.0
- VectorVest ProTrader 7
- VectorVest RealTime Derby Tool
- VectorVest Simulator
- VectorVest Variator
- VectorVest Watchdog
