HOT TOPICS LIST
- MACD
- Fibonacci
- RSI
- Gann
- ADXR
- Stochastics
- Volume
- Triangles
- Futures
- Cycles
- Volatility
- ZIGZAG
- MESA
- Retracement
- Aroon
INDICATORS LIST
LIST OF TOPICS
PRINT THIS ARTICLE
by Koos van der Merwe
Gold is rising astronomically, but holding shares in a mining company can be risky, especially if the company is selling their production forward. Are there alternatives?
Position: Sell
Koos van der Merwe
Has been a technical analyst since 1969, and has worked as a futures and options trader with First Financial Futures in Johannesburg, South Africa.
PRINT THIS ARTICLE
STRATEGIES
Investing in Gold and Silver Bullion
01/29/03 03:36:55 PMby Koos van der Merwe
Gold is rising astronomically, but holding shares in a mining company can be risky, especially if the company is selling their production forward. Are there alternatives?
Position: Sell
| Yes there are. You can buy gold and silver coins from banks, currency traders and coin collectors, but they always trade at a discount, the discount being the cost of purchase, which can be substantially less than the quoted price of gold itself. However, there is also Central Fund. |
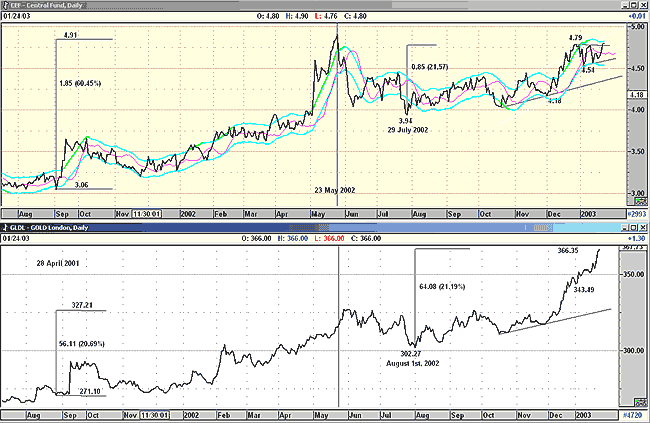
| Central Fund is a gold and silver bullion share investment, with at least 90% of its assets in gold and silver at all times. The bullion the fund is based on is stored in treasury vaults at a Canadian chartered bank on a segregated basis. This is a monetary fund and is listed on AMEX (symbol CEF) and the Toronto Stock Exchange ( symbol CEF'A). Below is a chart of Central Fund (upper) and the London Gold price (lower). Note how investors started as gold bulls and chased up the fund. From the end of August 2001 to the 23rd of May 2002, the gold price rose from $271.10 per oz. to $327.21 per oz., up $56.11 or 20.69%. Over the same period, the Central Fund rose $1.85, or 60.45%. |

|
| Figure 1: Central Fund correlating with the London Gold Price. |
| Graphic provided by: AdvancedGET. |
| |
| However, from the 23rd of May, the fund fell to a low of $3.94, then moved sideways slowly drifting up to a high of $4.79 on January 24, 2003, lower than the high of $4.91 reached on May 23. Over the same period, the London Gold price rose from $302.27 to $366.35, a move of 21.19% while the Central Fund, even though it did not exceed the May 23rd high, showed an increase of 21.57%. The fund appears to be correlating very closely to the gold price. |
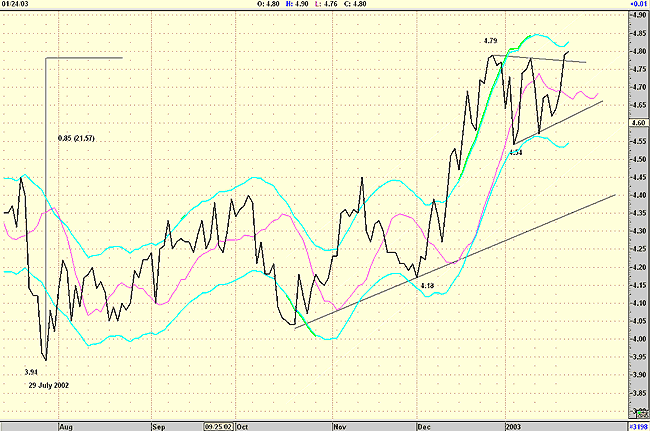
Can we forecast the future gold price using the chart of Central Fund? Figure 2 shows an expanded daily chart of Central Fund only. A triangle has developed over the last few weeks. The fund moved into the triangle from $4.18, topping out at $4.79. The difference is $0.61. Adding this to the low at $4.54 I get a target of $5.15. The rise is therefore 13.43% (( 0.61 / 4.54)*100). Figure 2: Daily chart of Central Fund. With the close correlation to the London Gold price, as shown in Figure 1, I can therefore expect the gold price to rise to $389.62. I calculated this estimate as follows. On January 2, 2003, Central Funds price was $4.54 and the gold price was $343.49. To this I added the rise of 13.43% to get the target of $389.62. With gold presently trading at more than $370 per oz., and Central Fund presently at $4.80, I have a target of $5.15, giving a 7.29% profit ($0.35). With the risk/reward ratio of 2.5 : 1, and a stop-loss of 10% from $4.80 ($0.48), it is not worth taking the risk. Nevertheless, this is a security that can be watched as a way to invest in pure gold, with a bit of silver thrown in. |
Has been a technical analyst since 1969, and has worked as a futures and options trader with First Financial Futures in Johannesburg, South Africa.
| Address: | 3256 West 24th Ave |
| Vancouver, BC | |
| Phone # for sales: | 6042634214 |
| E-mail address: | petroosp@gmail.com |
Click here for more information about our publications!
Comments
Date: 01/30/03Rank: 5Comment: did you intend to have your position as: sell? the article was making a bullish case.
Date: 02/04/03Rank: 5Comment:
Date: 02/16/03Rank: Comment: how can gold much up in future now sir
Date: 03/18/03Rank: 5Comment:

Request Information From Our Sponsors
- VectorVest, Inc.
- Executive Premier Workshop
- One-Day Options Course
- OptionsPro
- Retirement Income Workshop
- Sure-Fire Trading Systems (VectorVest, Inc.)
- Trading as a Business Workshop
- VectorVest 7 EOD
- VectorVest 7 RealTime/IntraDay
- VectorVest AutoTester
- VectorVest Educational Services
- VectorVest OnLine
- VectorVest Options Analyzer
- VectorVest ProGraphics v6.0
- VectorVest ProTrader 7
- VectorVest RealTime Derby Tool
- VectorVest Simulator
- VectorVest Variator
- VectorVest Watchdog
- StockCharts.com, Inc.
- Candle Patterns
- Candlestick Charting Explained
- Intermarket Technical Analysis
- John Murphy on Chart Analysis
- John Murphy's Chart Pattern Recognition
- John Murphy's Market Message
- MurphyExplainsMarketAnalysis-Intermarket Analysis
- MurphyExplainsMarketAnalysis-Visual Analysis
- StockCharts.com
- Technical Analysis of the Financial Markets
- The Visual Investor
