HOT TOPICS LIST
- MACD
- Fibonacci
- RSI
- Gann
- ADXR
- Stochastics
- Volume
- Triangles
- Futures
- Cycles
- Volatility
- ZIGZAG
- MESA
- Retracement
- Aroon
INDICATORS LIST
LIST OF TOPICS
PRINT THIS ARTICLE
by Gary Grosschadl
The Chicago Board Options Exchange Volatility Index is used by stock and options traders to monitor the market's anxiety level. There is an inverse relationship to market direction. Generally when one peaks, the other troughs.
Position: N/A
Gary Grosschadl
Independent Canadian equities trader and technical analyst based in Peterborough
Ontario, Canada.
PRINT THIS ARTICLE
DOUBLE BOTTOMS
VIX Topping Out Soon May Mean Market Bounce
01/30/03 11:08:24 AMby Gary Grosschadl
The Chicago Board Options Exchange Volatility Index is used by stock and options traders to monitor the market's anxiety level. There is an inverse relationship to market direction. Generally when one peaks, the other troughs.
Position: N/A
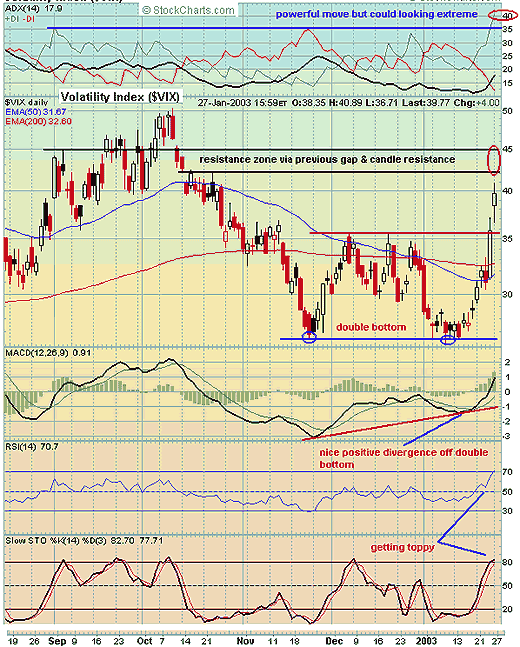
| When markets are rising sharply or going the other way, it sometimes helps to consider any clues the VIX chart offers. What the chart below shows is a definite move off a double bottom. As the indices were dragging down, the VIX made a big push through its 200-day EMA to hit previous resistance and previous congestion. Rather than halt there, it gapped and ran further the next day. |
| Now it is starting to look toppy as it approaches an outlined resistance zone. This zone relates to previous gap and candlestick resistance. With the stochastics and RSI indicators going into overbought territory, a reversal soon can be expected. This sudden thrust up may not be sustainable much longer so traders should watch for an end to the current downdraft in the indices. |

|
| Graphic provided by: StockCharts.com. |
| |
| Another point to consider is the move off the double bottom by measurement (trough to peak) will soon be satisfied if it runs to normal pattern completion. The directional movement indicator on top of the chart reflects this sudden bullish thrust. However the bullish power represented by +DI has shot well above previous levels, again hinting at an overextended move that may be short lived. As a final observation note how well the MACD (moving average convergence/divergence) foretold a likely bold move off the double bottom. This indicator did not bottom with the VIX's double bottom, clearly indicating some latent power. I find MACD and RSI often work very well in showing positive or negative divergences and are something to watch for. |
Independent Canadian equities trader and technical analyst based in Peterborough
Ontario, Canada.
| Website: | www.whatsonsale.ca/financial.html |
| E-mail address: | gwg7@sympatico.ca |
Click here for more information about our publications!
Comments
Date: 01/31/03Rank: 4Comment:
Date: 02/03/03Rank: 5Comment:
Date: 02/04/03Rank: 5Comment:
Date: 02/04/03Rank: 5Comment:
Date: 02/04/03Rank: 5Comment:
Date: 02/05/03Rank: 5Comment:

Request Information From Our Sponsors
- StockCharts.com, Inc.
- Candle Patterns
- Candlestick Charting Explained
- Intermarket Technical Analysis
- John Murphy on Chart Analysis
- John Murphy's Chart Pattern Recognition
- John Murphy's Market Message
- MurphyExplainsMarketAnalysis-Intermarket Analysis
- MurphyExplainsMarketAnalysis-Visual Analysis
- StockCharts.com
- Technical Analysis of the Financial Markets
- The Visual Investor
- VectorVest, Inc.
- Executive Premier Workshop
- One-Day Options Course
- OptionsPro
- Retirement Income Workshop
- Sure-Fire Trading Systems (VectorVest, Inc.)
- Trading as a Business Workshop
- VectorVest 7 EOD
- VectorVest 7 RealTime/IntraDay
- VectorVest AutoTester
- VectorVest Educational Services
- VectorVest OnLine
- VectorVest Options Analyzer
- VectorVest ProGraphics v6.0
- VectorVest ProTrader 7
- VectorVest RealTime Derby Tool
- VectorVest Simulator
- VectorVest Variator
- VectorVest Watchdog
