HOT TOPICS LIST
- MACD
- Fibonacci
- RSI
- Gann
- ADXR
- Stochastics
- Volume
- Triangles
- Futures
- Cycles
- Volatility
- ZIGZAG
- MESA
- Retracement
- Aroon
INDICATORS LIST
LIST OF TOPICS
PRINT THIS ARTICLE
by David Penn
The bull market in the Swiss franc looks due for a mild correction.
Position: N/A
David Penn
Technical Writer for Technical Analysis of STOCKS & COMMODITIES magazine, Working-Money.com, and Traders.com Advantage.
PRINT THIS ARTICLE
HEAD & SHOULDERS
Swiss Franc's Head and Shoulders Bottom
01/29/03 03:36:39 PMby David Penn
The bull market in the Swiss franc looks due for a mild correction.
Position: N/A
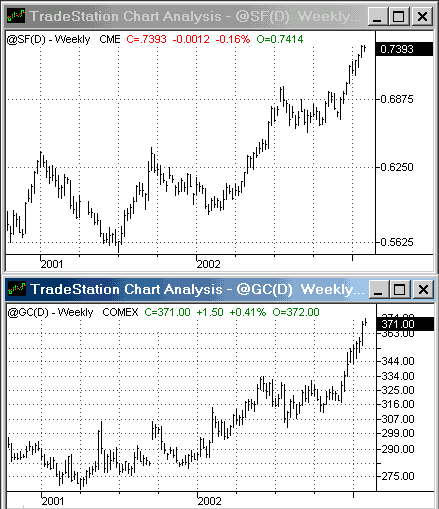
| Trader Teresa Lo of TrendVUE.com (see our interview with Teresa in the November 2002 issue of Stocks and Commodities magazine) made the point in an "Investment Outlook" recently e-mailed to subscribers that one alternative way to play the gold market was to invest in or trade the Swiss franc. As the charts below show, the correlation between the price of gold and the Swiss franc is not a perfect one. But Lo's basic point--that the Swiss franc was another way of playing the dollar's decline--is spot on. |

|
| Figure 1: No perfect correlation, the Swiss franc and gold nonetheless both have traded well against the dollar since the second half of 2001. |
| Graphic provided by: TradeStation. |
| |
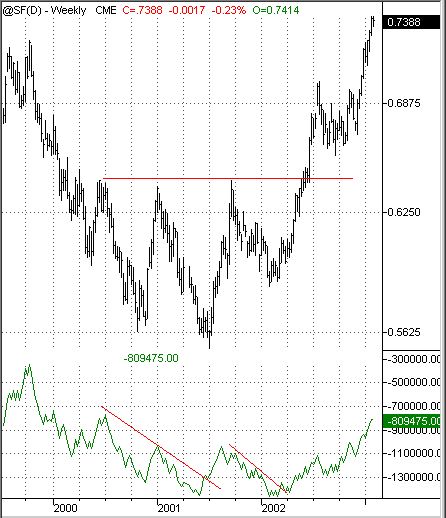
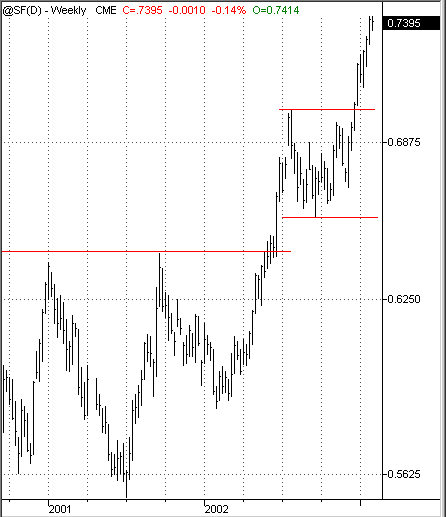
Unlike gold, however, the bull market in the Swiss franc came about as the result of a head and shoulders bottom. The lows of this bullish reversal formation occurred in late October 2000 (left shoulder), early July 2001 (head), and mid-February 2002 (right shoulder). This provides for not only a largish head and shoulders in duration terms (with a breakout in June 2002, this reversal pattern is approximately 20 months long), but also a strong base from which a new bull market could begin--as opposed to simply a bullish breakout. Figure 2: This head and shoulders bottom in the Swiss franc anticipated a double digit percent rally for the traditionally safe-haven currency. Bullish breakout or new bull market, has the Swiss franc's rally run its course for now? The measurement rule for head and shoulders bottoms--which is a variant of the swing rule written about by Stan Weinstein in his "Secrets for Profiting in Bull and Bear Markets"--suggests that Swiss franc bulls may want to slow down their 2002 stampede over the next few months. Taking the size of the formation (neckline or support level at breakout less the value at the lowermost point of the formation) and adding it to the value at the breakout point, provides for a minimum upside target of about 0.7273, a point the Swiss franc reached in mid-January 2003. There is also a relevant volume trend, here shown by the on-balance volume indicator, pointing to higher volume on the left side of the formation compared to the right. There is not a great deal of resistance in this area, however, with the Swiss franc now trading higher than it has at any point since mid-1999. The real stopping points for the Swiss franc lie in the range between 0.7500 and 0.8125, an area of peaks from the most recent leg (1998-2001) of the Swiss franc's longer-term bear market from 1995 to 2001. There is support for prices advancing beyond the minimum upside target from the head and shoulders bottom. This support comes from the short-term consolidation between, roughly, 0.7010 and 0.6570, that took place during the second half of 2002. If that consolidation marked the size of the next move up (not at all uncommon with consolidations in trending markets), then the consolidation allows for a Swiss franc at 0.7448. |
 Figure 3: A close-up of the Swiss franc's consolidation and breakout in the second half of 2002. That said about near-term resistance, I can't help but feel that the top "anti-dollar" or "anti-US stocks" entities such as gold, the Swiss franc and perhaps commodities in general are overextended right now and due for a correction. Gold appears to be one candidate for this club--particularly as prices climb above the $370 mark and sentiment grows increasingly bullish (mostly on the margins, however; the average, retail investor holds very little gold, if any.) And while I think that the similarly "anti-dollar" Swiss franc is likely to correct soon in the short-term, there is an interesting difference between the Swiss franc and gold. |
| Gold bottomed in 2001 after a long, extended secular bear market of twenty years. The Swiss franc, however, has been in a secular bear market, really, ever since currencies began floating in the early 1970s. While I cannot post the historical chart of the Swiss franc here, consider the following: after major world currencies began floating in the early 1970s, the Swiss franc climbed from about 0.2500 to 0.7000 by 1979, then fell to 0.3000 by 1985, then rallied to 0.9000 by 1995, then fell to 0.5500 by 2000-01. As such, the historical trendline (going back to 1971) is still intact as is, importantly, the long-term low (0.5500) from the Swiss franc's 1985-1995 cyclical bull market. Insofar as this long-term low holds (by the way, this long-term coincides with the low point in the head and shoulders formation discussed here), then it seems possible, if not likely, that the Swiss franc has at least one more cyclical bull market left in it. |
Technical Writer for Technical Analysis of STOCKS & COMMODITIES magazine, Working-Money.com, and Traders.com Advantage.
| Title: | Technical Writer |
| Company: | Technical Analysis, Inc. |
| Address: | 4757 California Avenue SW |
| Seattle, WA 98116 | |
| Phone # for sales: | 206 938 0570 |
| Fax: | 206 938 1307 |
| Website: | www.Traders.com |
| E-mail address: | DPenn@traders.com |
Traders' Resource Links | |
| Charting the Stock Market: The Wyckoff Method -- Books | |
| Working-Money.com -- Online Trading Services | |
| Traders.com Advantage -- Online Trading Services | |
| Technical Analysis of Stocks & Commodities -- Publications and Newsletters | |
| Working Money, at Working-Money.com -- Publications and Newsletters | |
| Traders.com Advantage -- Publications and Newsletters | |
| Professional Traders Starter Kit -- Software | |
Click here for more information about our publications!
Comments
Date: 01/31/03Rank: 5Comment:

Request Information From Our Sponsors
- StockCharts.com, Inc.
- Candle Patterns
- Candlestick Charting Explained
- Intermarket Technical Analysis
- John Murphy on Chart Analysis
- John Murphy's Chart Pattern Recognition
- John Murphy's Market Message
- MurphyExplainsMarketAnalysis-Intermarket Analysis
- MurphyExplainsMarketAnalysis-Visual Analysis
- StockCharts.com
- Technical Analysis of the Financial Markets
- The Visual Investor
- VectorVest, Inc.
- Executive Premier Workshop
- One-Day Options Course
- OptionsPro
- Retirement Income Workshop
- Sure-Fire Trading Systems (VectorVest, Inc.)
- Trading as a Business Workshop
- VectorVest 7 EOD
- VectorVest 7 RealTime/IntraDay
- VectorVest AutoTester
- VectorVest Educational Services
- VectorVest OnLine
- VectorVest Options Analyzer
- VectorVest ProGraphics v6.0
- VectorVest ProTrader 7
- VectorVest RealTime Derby Tool
- VectorVest Simulator
- VectorVest Variator
- VectorVest Watchdog
