HOT TOPICS LIST
- MACD
- Fibonacci
- RSI
- Gann
- ADXR
- Stochastics
- Volume
- Triangles
- Futures
- Cycles
- Volatility
- ZIGZAG
- MESA
- Retracement
- Aroon
INDICATORS LIST
LIST OF TOPICS
PRINT THIS ARTICLE
by Gary Grosschadl
The power of three is pervasive throughout many forms of technical analysis. Triple tops and bottoms, head and shoulder formations, fibonacci retracements (occurring in one third increments), three white soldiers and three black crows in candlestick terminology, and fan lines are good examples.
Position: N/A
Gary Grosschadl
Independent Canadian equities trader and technical analyst based in Peterborough
Ontario, Canada.
PRINT THIS ARTICLE
FAN LINES
S&P 500 Fails on the Third Fan Line (The Power of Three)
01/27/03 12:47:00 PMby Gary Grosschadl
The power of three is pervasive throughout many forms of technical analysis. Triple tops and bottoms, head and shoulder formations, fibonacci retracements (occurring in one third increments), three white soldiers and three black crows in candlestick terminology, and fan lines are good examples.
Position: N/A
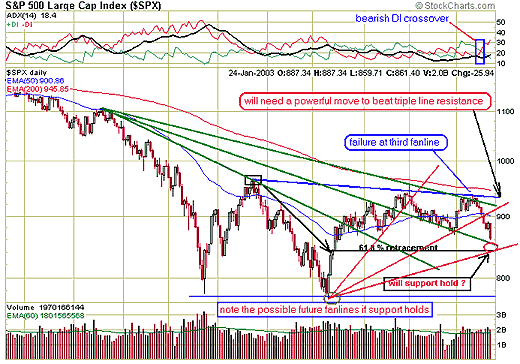
| Fan lines can be described as trendlines that are drawn from the same point of origin, and "fan" across a chart. They can be drawn from overhead points where they act as resistance or from below where they can offer support. The chart below shows both, however the lower fan lines are only speculative and have yet to be proven, but they do illustrate this concept well. As with many patterns, fan lines tend to be stronger when there is good symmetry and we see good symmetry here with lines being equidistant apart. Some may call this a possible head and shoulders failure but note how those using fan lines were warned of a downturn far ahead of those watching the head and shoulders pattern. In this way fan line tests may lead to head and shoulder tests. |
| The DMI or directional movement indicator served traders well here with a warning via a bearish DI crossover, showing selling power taking the upper hand over buying power. Note how the weak ADX (below 20 during previous bullish phase) correctly showed that trend strength was poor which led to this DI crossover. Now the ADX line is moving up between the DIs and this has more bearish implications. If the ADX does not stall out very soon, this bearish trend will strengthen. |

|
| Graphic provided by: StockCharts.com. |
| |
| Where might support kick in? Looking at the upper fan lines, there is a possibility of support at the fibonacci-type retracement level of 62%. This is also at a previous fan line/candlestick support level. If this support does hold, then an argument can be made for three new fan lines coming into play going ahead. The irony then will be that the "power of three" both buried and saved this broadest of market indices in this shorter daily time frame. Should support fail here, the index could come down further to test 800. Looking ahead, there likely will be stiff resistance when this market eventually resumes a bullish uptrend, from three (there is that number again) lines of future resistance - the 200-day moving average, trendline and fan line resistance. |
Independent Canadian equities trader and technical analyst based in Peterborough
Ontario, Canada.
| Website: | www.whatsonsale.ca/financial.html |
| E-mail address: | gwg7@sympatico.ca |
Click here for more information about our publications!
Comments
Date: 01/28/03Rank: 5Comment:
Date: 01/28/03Rank: 4Comment:
Date: 01/28/03Rank: 4Comment:
Date: 01/28/03Rank: 5Comment:
Date: 01/29/03Rank: 5Comment:
Date: 01/30/03Rank: 5Comment: Great piece! Looking forward to your follow up analysis of this same chart. Thanks john grant

Request Information From Our Sponsors
- StockCharts.com, Inc.
- Candle Patterns
- Candlestick Charting Explained
- Intermarket Technical Analysis
- John Murphy on Chart Analysis
- John Murphy's Chart Pattern Recognition
- John Murphy's Market Message
- MurphyExplainsMarketAnalysis-Intermarket Analysis
- MurphyExplainsMarketAnalysis-Visual Analysis
- StockCharts.com
- Technical Analysis of the Financial Markets
- The Visual Investor
- VectorVest, Inc.
- Executive Premier Workshop
- One-Day Options Course
- OptionsPro
- Retirement Income Workshop
- Sure-Fire Trading Systems (VectorVest, Inc.)
- Trading as a Business Workshop
- VectorVest 7 EOD
- VectorVest 7 RealTime/IntraDay
- VectorVest AutoTester
- VectorVest Educational Services
- VectorVest OnLine
- VectorVest Options Analyzer
- VectorVest ProGraphics v6.0
- VectorVest ProTrader 7
- VectorVest RealTime Derby Tool
- VectorVest Simulator
- VectorVest Variator
- VectorVest Watchdog
