HOT TOPICS LIST
- MACD
- Fibonacci
- RSI
- Gann
- ADXR
- Stochastics
- Volume
- Triangles
- Futures
- Cycles
- Volatility
- ZIGZAG
- MESA
- Retracement
- Aroon
INDICATORS LIST
LIST OF TOPICS
PRINT THIS ARTICLE
by Kevin Hopson
Spinnaker Exploration has been in a long-term downtrend since May of last year. Elliott Wave theory indicates a potential decline to new lows before this trend reverses.
Position: Sell
Kevin Hopson
Kevin has been a technical analyst for roughly 10 years now. Previously, Kevin owned his own business and acted as a registered investment advisor, specializing in energy. He was also a freelance oil analyst for Orient Trading Co., a commodity futures trading firm in Japan. Kevin is currently a freelance writer.
PRINT THIS ARTICLE
ELLIOTT WAVE
Spinnaker Exploration Set to Hit New Lows?
01/27/03 12:43:20 PMby Kevin Hopson
Spinnaker Exploration has been in a long-term downtrend since May of last year. Elliott Wave theory indicates a potential decline to new lows before this trend reverses.
Position: Sell
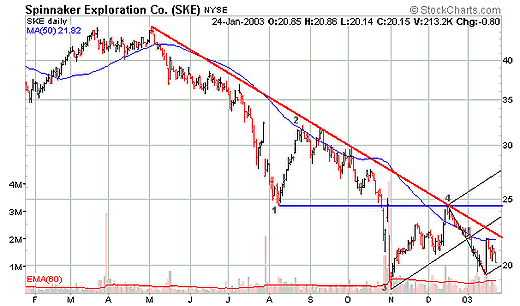
| Spinnaker Exploration (SKE), an oil and gas exploration and production company with primary interests in the Gulf of Mexico, has been in a clear downtrend since May of last year. This is indicated by the red downtrend line in the chart. Notice how this trendline has turned away prices every time the stock has proceeded to test it. This shows the real strength of the downtrend. |
| To make matters worse, the long-term downtrend appears to be in its fifth wave (or third leg) down. The green numbers in the chart indicate each significant pivot point (or completion of the prior wave). Since trends tend to be completed in waves of five and each down leg in a negative trend often breaches the prior low, the chart indicates a potential decline to new lows. More specifically, the fifth pivot (down leg from pivot 4) will likely breach the pivot 3 low, meaning that the stock should hit a new 52-week low before the long-term trend reverses. |

|
| Graphic provided by: StockCharts.com. |
| |
| There are a couple of other things in the chart that support this theory. For example, notice the blue median line, which was calculated by drawing a line from pivot 1 through the middle of pivots 2 and 3. This type of median line is normally used to predict the top of the second leg up (or pivot 4) in a downtrend. As you can see in the chart, the blue median line, coupled with the long-term downtrend line, perfectly predicted this turning point. |
| Additionally, notice how the stock price failed to test the median line of the black pitchfork. This - more often than not - indicates price weakness and usually leads to a break of support along the lower parallel line, which is currently converging around the $20.00 level. In other words, it looks as if Spinnaker Exploration will soon break below the $20.00 level, eventually testing its 52-week low ($18.45) down the road. |
Kevin has been a technical analyst for roughly 10 years now. Previously, Kevin owned his own business and acted as a registered investment advisor, specializing in energy. He was also a freelance oil analyst for Orient Trading Co., a commodity futures trading firm in Japan. Kevin is currently a freelance writer.
| Glen Allen, VA | |
| E-mail address: | hopson_1@yahoo.com |
Click here for more information about our publications!
Comments
Date: 01/30/03Rank: 5Comment:

Request Information From Our Sponsors
- VectorVest, Inc.
- Executive Premier Workshop
- One-Day Options Course
- OptionsPro
- Retirement Income Workshop
- Sure-Fire Trading Systems (VectorVest, Inc.)
- Trading as a Business Workshop
- VectorVest 7 EOD
- VectorVest 7 RealTime/IntraDay
- VectorVest AutoTester
- VectorVest Educational Services
- VectorVest OnLine
- VectorVest Options Analyzer
- VectorVest ProGraphics v6.0
- VectorVest ProTrader 7
- VectorVest RealTime Derby Tool
- VectorVest Simulator
- VectorVest Variator
- VectorVest Watchdog
- StockCharts.com, Inc.
- Candle Patterns
- Candlestick Charting Explained
- Intermarket Technical Analysis
- John Murphy on Chart Analysis
- John Murphy's Chart Pattern Recognition
- John Murphy's Market Message
- MurphyExplainsMarketAnalysis-Intermarket Analysis
- MurphyExplainsMarketAnalysis-Visual Analysis
- StockCharts.com
- Technical Analysis of the Financial Markets
- The Visual Investor
