HOT TOPICS LIST
- MACD
- Fibonacci
- RSI
- Gann
- ADXR
- Stochastics
- Volume
- Triangles
- Futures
- Cycles
- Volatility
- ZIGZAG
- MESA
- Retracement
- Aroon
INDICATORS LIST
LIST OF TOPICS
PRINT THIS ARTICLE
by Kevin Hopson
EnCana Corp. has been consolidating in the $30.00 to $32.00 range since hitting a new 52-week high last December. The bullish flag formation indicates an eventual break to the upside.
Position: Buy
Kevin Hopson
Kevin has been a technical analyst for roughly 10 years now. Previously, Kevin owned his own business and acted as a registered investment advisor, specializing in energy. He was also a freelance oil analyst for Orient Trading Co., a commodity futures trading firm in Japan. Kevin is currently a freelance writer.
PRINT THIS ARTICLE
FLAGS AND PENNANTS
A Bullish Flag Formation for EnCana Corp.
01/28/03 10:04:30 AMby Kevin Hopson
EnCana Corp. has been consolidating in the $30.00 to $32.00 range since hitting a new 52-week high last December. The bullish flag formation indicates an eventual break to the upside.
Position: Buy
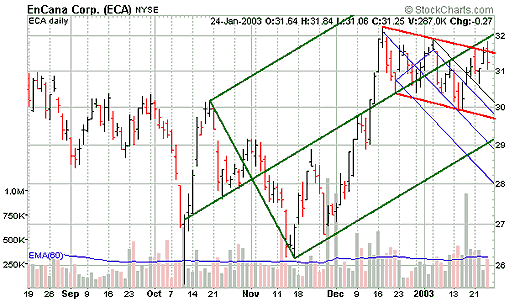
| EnCana Corp. (ECA) is a Canadian-based oil and gas exploration and production company with significant interests in Western Canada, offshore Canada's East Coast, the United States Rocky Mountains and the Gulf of Mexico. Technically speaking, the stock has been consolidating in the $30.00 to $32.00 range since breaking out last December. As you can see in the chart, EnCana topped out around the $30.00 level a number of times before finally breaking through in December. |
| The primary culprit for holding the stock back prior to this was a significant amount of open interest in the January '03 $30 call options. Sellers of these contracts continued to put downside pressure on the stock to try and keep these options out-of-the-money. However, buyers eventually won the battle, as EnCana broke through the $30.00 level and proceeded to hit a new 52-week high of $32.36 in the process. Since spiking to a new 52-week high last December, EnCana has been consolidating within a declining channel (or a bullish flag formation), as indicated by the downsloping red lines in the chart. |

|
| Graphic provided by: StockCharts.com. |
| |
| Because this tends to be a continuation pattern and the prior (or long-term) trend is up, it is likely that EnCana will break to the upside. Unfortunately, EnCana has been testing the top channel line of the flag formation the last couple of days but has failed to close above it. Additionally, the green median line of the long-term pitchfork is creating further resistance for the stock around the $32.00 level. |
| Despite EnCana's inability to break out in recent days, I believe it is just a matter of time before the stock breaks its 52-week high and moves higher. One reason is the stock's strength the last couple of weeks. For example, while the S&P 500 has declined by 7.0 percent during this time, EnCana's stock price is up 3.6 percent. Additionally, notice the blue mini-pitchfork in the chart. The sliding black parallel line above it indicates the short-term downtrend line from this month's intraday high. EnCana broke above this line a week ago, giving a short-term "buy" signal and suggesting further strength in the stock price. Look for a close above the top red channel line on strong volume to confirm the breakout. |
Kevin has been a technical analyst for roughly 10 years now. Previously, Kevin owned his own business and acted as a registered investment advisor, specializing in energy. He was also a freelance oil analyst for Orient Trading Co., a commodity futures trading firm in Japan. Kevin is currently a freelance writer.
| Glen Allen, VA | |
| E-mail address: | hopson_1@yahoo.com |
Click here for more information about our publications!
Comments
Date: 02/04/03Rank: 5Comment:

|

Request Information From Our Sponsors
- StockCharts.com, Inc.
- Candle Patterns
- Candlestick Charting Explained
- Intermarket Technical Analysis
- John Murphy on Chart Analysis
- John Murphy's Chart Pattern Recognition
- John Murphy's Market Message
- MurphyExplainsMarketAnalysis-Intermarket Analysis
- MurphyExplainsMarketAnalysis-Visual Analysis
- StockCharts.com
- Technical Analysis of the Financial Markets
- The Visual Investor
- VectorVest, Inc.
- Executive Premier Workshop
- One-Day Options Course
- OptionsPro
- Retirement Income Workshop
- Sure-Fire Trading Systems (VectorVest, Inc.)
- Trading as a Business Workshop
- VectorVest 7 EOD
- VectorVest 7 RealTime/IntraDay
- VectorVest AutoTester
- VectorVest Educational Services
- VectorVest OnLine
- VectorVest Options Analyzer
- VectorVest ProGraphics v6.0
- VectorVest ProTrader 7
- VectorVest RealTime Derby Tool
- VectorVest Simulator
- VectorVest Variator
- VectorVest Watchdog
