HOT TOPICS LIST
- MACD
- Fibonacci
- RSI
- Gann
- ADXR
- Stochastics
- Volume
- Triangles
- Futures
- Cycles
- Volatility
- ZIGZAG
- MESA
- Retracement
- Aroon
INDICATORS LIST
LIST OF TOPICS
PRINT THIS ARTICLE
by David Penn
Does an appreciating currency suggest more deflation for the land of the rising yen?
Position: N/A
David Penn
Technical Writer for Technical Analysis of STOCKS & COMMODITIES magazine, Working-Money.com, and Traders.com Advantage.
PRINT THIS ARTICLE
HEAD & SHOULDERS
The Yen's Head and Shoulders Bottom
01/24/03 08:18:40 AMby David Penn
Does an appreciating currency suggest more deflation for the land of the rising yen?
Position: N/A
| If the dollar is declining against other currencies--and as of this writing, the US Dollar index has dropped beneath 100 for the first time since 1999--then other currencies must be rising. As I've noted in other Traders.com Advantage articles, two beneficiaries of the dollar's decline have been the British pound ("The British Pound's Ascending Triangle," October 23, 2002) and the euro ("The Euro's Cup with Handle Breakout," January 17, 2003). |
| The Japanese yen, however, has been relatively reluctant to join the counter-greenback party. Although the yen rose strongly throughout the first half of 2002--moving from 0.7560 to 0.8750 from January to early July (a gain of almost 16%)--the second half of 2002 saw the yen give back almost half of these gains, retreating to 0.8013 by the beginning of December. While 2002 ended with the yen up nearly 12%, it was an exceptionally volatile ride--particularly compared to the smooth bullish ascents of the British pound (up more than 14% on the year) and the euro (up 18%). |

|
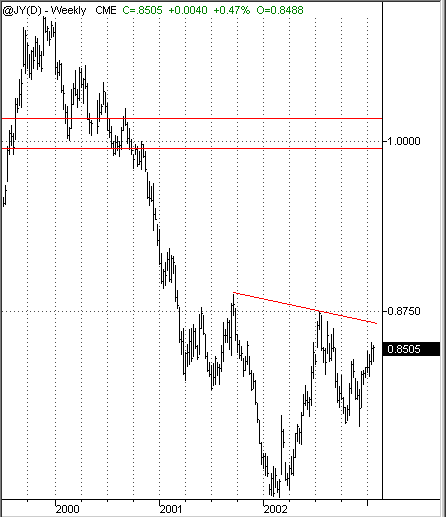
| Figure 1: This complex head and shoulders bottom could send the Japanese yen soaring toward levels not seen since the fall of 2000. |
| Graphic provided by: TradeStation. |
| |
| However, the yen now looks poised to make what could be a sizable run on levels not seen since 2000, when the yen broke down from a cyclical bull market that began in 1998. The form of this run appears to be a head and shoulders bottom, a formation that extends from the latter part of the first quarter of 2001 to the present. What will determine the successful completion of the head and shoulders bottom is the current rally in the Japanese yen, a rally that began with the lows in December 2002. |
 Figure 2: A close-up look at the right shoulder with its twin "mini-bottoms." The December-based rally will need to continue for the yen to have a successful breakout to even higher ground. The head and shoulders bottom in the yen is technically of the complex variety. I say this because the left side of the formation features a sort of "double shoulder" with two "mini-bottoms"--one in April and one in July 2001. Similarly, it appears that the right side of this potential head and shoulders bottom also features a double shoulder with two mini-bottoms--one in October and one in December of 2002. Although the right shoulder is somewhat lower than the left shoulder, the symmetry with regard to the double shoulders is a positive sign that the formation is valid. Of course, whether the formation is actually successful remains to be seen. |
| Success would be defined as a breakout above the 0.8750/0.8867 level, which characterizes the downwardly sloping neckline of the formation. Yen bulls might want to keep a close watch on the current rally from the December lows; a serious trendline break to the downside could quite easily imperil a currency that has, from a longer-term perspective, been in decline since its peak in 1995. Upon any successful breakout, however, the formation size does again suggest that any up move in the Japanese yen could be significant. Adding the formation size (either 0.1190 or 0.1307, depending on your measurement) to the value at the neckline (either 0.8750 or 0.8867, again depending on your measurement), provides a minimum upside target range of 0.9940 to 1.0174. Hitting such a target would take the yen deep into the consolidation range of the second half of 2000--and likely spawn another round of anti-deflationary hand-wringing in the land of the ever-rising yen. |
Technical Writer for Technical Analysis of STOCKS & COMMODITIES magazine, Working-Money.com, and Traders.com Advantage.
| Title: | Technical Writer |
| Company: | Technical Analysis, Inc. |
| Address: | 4757 California Avenue SW |
| Seattle, WA 98116 | |
| Phone # for sales: | 206 938 0570 |
| Fax: | 206 938 1307 |
| Website: | www.Traders.com |
| E-mail address: | DPenn@traders.com |
Traders' Resource Links | |
| Charting the Stock Market: The Wyckoff Method -- Books | |
| Working-Money.com -- Online Trading Services | |
| Traders.com Advantage -- Online Trading Services | |
| Technical Analysis of Stocks & Commodities -- Publications and Newsletters | |
| Working Money, at Working-Money.com -- Publications and Newsletters | |
| Traders.com Advantage -- Publications and Newsletters | |
| Professional Traders Starter Kit -- Software | |
Click here for more information about our publications!
PRINT THIS ARTICLE

|

Request Information From Our Sponsors
- StockCharts.com, Inc.
- Candle Patterns
- Candlestick Charting Explained
- Intermarket Technical Analysis
- John Murphy on Chart Analysis
- John Murphy's Chart Pattern Recognition
- John Murphy's Market Message
- MurphyExplainsMarketAnalysis-Intermarket Analysis
- MurphyExplainsMarketAnalysis-Visual Analysis
- StockCharts.com
- Technical Analysis of the Financial Markets
- The Visual Investor
- VectorVest, Inc.
- Executive Premier Workshop
- One-Day Options Course
- OptionsPro
- Retirement Income Workshop
- Sure-Fire Trading Systems (VectorVest, Inc.)
- Trading as a Business Workshop
- VectorVest 7 EOD
- VectorVest 7 RealTime/IntraDay
- VectorVest AutoTester
- VectorVest Educational Services
- VectorVest OnLine
- VectorVest Options Analyzer
- VectorVest ProGraphics v6.0
- VectorVest ProTrader 7
- VectorVest RealTime Derby Tool
- VectorVest Simulator
- VectorVest Variator
- VectorVest Watchdog
