HOT TOPICS LIST
- MACD
- Fibonacci
- RSI
- Gann
- ADXR
- Stochastics
- Volume
- Triangles
- Futures
- Cycles
- Volatility
- ZIGZAG
- MESA
- Retracement
- Aroon
INDICATORS LIST
LIST OF TOPICS
PRINT THIS ARTICLE
by David Penn
Extensions and third Elliott waves.
Position: N/A
David Penn
Technical Writer for Technical Analysis of STOCKS & COMMODITIES magazine, Working-Money.com, and Traders.com Advantage.
PRINT THIS ARTICLE
ELLIOTT WAVE
Revisiting "Third Waves: Then and Now"
01/23/03 09:23:33 AMby David Penn
Extensions and third Elliott waves.
Position: N/A
| Writing about third waves in the Elliott Wave Principle, authors A.J. Frost and Robert Prechter note that "third waves usually generate the greatest volume and price movement and are most often the extended wave in a series." This is a timely reminder as price action has helped clarify for me just how the market is following a relatively consistent wave pattern. By market, I'm referring specifically to the S&P 500, which has been called by the National Bureau of Economic Research in Cambridge "the single best indicator among the dozen that the Commerce Department uses to foreshadow broad economic trends." |
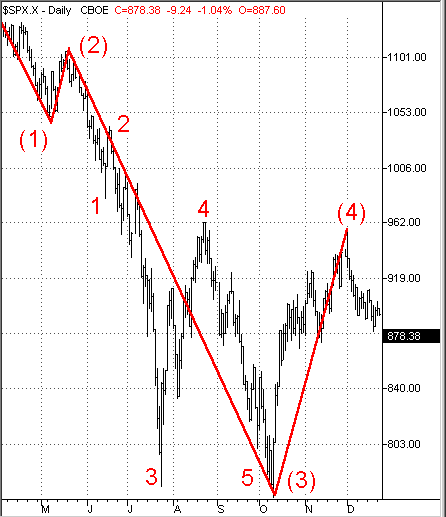
| Back in the fall of 2002, I had been confused by the twin declines of July and October, and found it difficult to place these declines in the context of a wave count that had, up until then, seemed more or less straightforward. Since that time, I have discovered two errors in my counting. The first (and less forgivable mistake) was calling the sizable decline from the spring of 2002 to the summer of 2002 an intermediate first decline. The problem here arrives in subsequently calling the decline from August to October an intermediate third decline. Such a designation would make the intermediate first wave longer than the intermediate third wave--which is generally regarded as unlikely to most Elliott wave theorists (who tend to see the third wave as, if not the longest wave, then at least not the shortest). As such, I have recast my count to make the intermediate first decline beginning March 2002 end in mid-May (more specifically, mid-March with the S&P 500 at 1173 to early May with the S&P at 1050). This allows for the intermediate third decline to begin later in May at about 1107 and end in early October at about 770. |

|
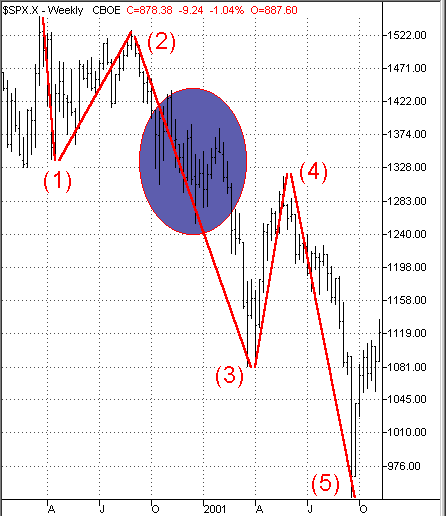
| Figure 1: A pair of extensions flesh out this intermediate third decline in the first part (Primary A correction wave) of the bear market. |
| Graphic provided by: TradeStation. |
| |
What does such an intermediate third then suggest for the July decline? Herein lies my second mistake. In a Traders.com Advantage piece back in October ("Third Waves: Then and Now"), I noted that the intermediate third decline in the Primary A decline (March 2000 to September 2001) featured a bullish extension that saw the S&P 500 climb from 1254 on December 21, 2000 to 1383 on January 31, 2001, a 129 point/10% gain. In addition, I had overlooked an earlier extension of similar scope that had occurred in the fall of 2000: a 132 point/10% gain from the low of October 18th to the high of November 8th. While neither of these extensions were sizable enough to throw off a veteran Elliott wave counter, they should have served as reminders to me of the sort of "kinks" third waves can produce. Here are Frost and Prechter again on third waves, focusing this time on the most powerful of third waves: the third of a third:"It follows, of course, that the third wave of a third wave ... will be the most volatile point of strength in any wave sequence. Such points invariably produce breakouts, breakdowns, runaway gaps, volume expansions, exceptional breadth, thrust, major Dow Theory trend confirmations and large hourly, daily, weekly, monthly or yearly moves in the market, depending on the degree of the wave."  Figure 2. The second half of the bear market (Primary C corrective wave) includes an intermediate third decline with an extension from late July to late August. It is with this thinking that I return to the summer decline of 2002 and correctly, in my view, reconsider that decline to have represented an extension in the intermediate third decline of the Primary C correction wave (which began in March 2002). It is a sizable extension to be sure, compared to the two extensions I believe took place in the intermediate third of the Primary A correction wave of 2000-2001. Yet it seems far more likely that the July 2002 decline represents an extension rather than an intermediate third. For the July decline to be an intermediate third decline, it would be almost inescapable to conclude that the rally in August would represent an intermediate fourth and the October decline an intermediate fifth. These conclusions are difficult to accept in large part because they would strongly suggest that the Primary C correction wave had been completed, and that a new bull market of Cycle level would soon follow (a Cycle B rally following the Cycle A correction). |
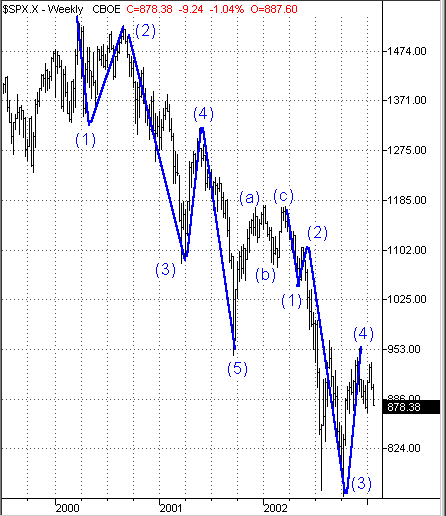
While there are many who do believe that a cyclical (small "c") bull market is imminent, there remain too many bearish factors for me to believe that the market has bottomed (here, this would mean that the Primary C correction wave had been completed.) These factors include, but are not limited to: market sentiment, which remains if not outright bullish then at least exceptionally optimistic; stock market valuations, which remain high by most reasonable standards such as P/E based on operating earnings; and the dividend yield of the Dow Jones Industrial Average, which remains at historically low levels. By my wave count, the Primary C correction wave is closer to its end than to its beginning (as the chart shows, I suggest that the S&P 500 has just completed an intermediate fourth advance in the Primary C correction wave), but the market is still an intermediate fifth decline away from both cyclical and Cycle bottoms. And as we saw with the intermediate fifth decline early in 2001 that took the S&P 500 from 1316 on May 22 to 945 on September 21 (a 28% decline), the final wave can make a world of difference. Figure 3. A count of the intermediate level waves in the bear market that began March 2000. Only an intermediate fifth decline remains before the Primary A-B-C correction is complete. |
Technical Writer for Technical Analysis of STOCKS & COMMODITIES magazine, Working-Money.com, and Traders.com Advantage.
| Title: | Technical Writer |
| Company: | Technical Analysis, Inc. |
| Address: | 4757 California Avenue SW |
| Seattle, WA 98116 | |
| Phone # for sales: | 206 938 0570 |
| Fax: | 206 938 1307 |
| Website: | www.Traders.com |
| E-mail address: | DPenn@traders.com |
Traders' Resource Links | |
| Charting the Stock Market: The Wyckoff Method -- Books | |
| Working-Money.com -- Online Trading Services | |
| Traders.com Advantage -- Online Trading Services | |
| Technical Analysis of Stocks & Commodities -- Publications and Newsletters | |
| Working Money, at Working-Money.com -- Publications and Newsletters | |
| Traders.com Advantage -- Publications and Newsletters | |
| Professional Traders Starter Kit -- Software | |
Click here for more information about our publications!
Comments
Date: 01/28/03Rank: 5Comment:

|

Request Information From Our Sponsors
- VectorVest, Inc.
- Executive Premier Workshop
- One-Day Options Course
- OptionsPro
- Retirement Income Workshop
- Sure-Fire Trading Systems (VectorVest, Inc.)
- Trading as a Business Workshop
- VectorVest 7 EOD
- VectorVest 7 RealTime/IntraDay
- VectorVest AutoTester
- VectorVest Educational Services
- VectorVest OnLine
- VectorVest Options Analyzer
- VectorVest ProGraphics v6.0
- VectorVest ProTrader 7
- VectorVest RealTime Derby Tool
- VectorVest Simulator
- VectorVest Variator
- VectorVest Watchdog
- StockCharts.com, Inc.
- Candle Patterns
- Candlestick Charting Explained
- Intermarket Technical Analysis
- John Murphy on Chart Analysis
- John Murphy's Chart Pattern Recognition
- John Murphy's Market Message
- MurphyExplainsMarketAnalysis-Intermarket Analysis
- MurphyExplainsMarketAnalysis-Visual Analysis
- StockCharts.com
- Technical Analysis of the Financial Markets
- The Visual Investor
