HOT TOPICS LIST
- MACD
- Fibonacci
- RSI
- Gann
- ADXR
- Stochastics
- Volume
- Triangles
- Futures
- Cycles
- Volatility
- ZIGZAG
- MESA
- Retracement
- Aroon
INDICATORS LIST
LIST OF TOPICS
PRINT THIS ARTICLE
by Gary Grosschadl
PeopleSoft Inc. illustrates a good example of bullish pattern failure. To the alert and flexible trader, it didn't matter which way it went. The move was tradable.
Position: N/A
Gary Grosschadl
Independent Canadian equities trader and technical analyst based in Peterborough
Ontario, Canada.
PRINT THIS ARTICLE
CHART ANALYSIS
Pattern Success or Failure - Follow the "Elephant Tracks"
01/23/03 11:00:03 AMby Gary Grosschadl
PeopleSoft Inc. illustrates a good example of bullish pattern failure. To the alert and flexible trader, it didn't matter which way it went. The move was tradable.
Position: N/A
| "The market has a mind of its own and likes to prove the majority wrong." When patterns are too obvious and too many rush to one side of the ship, guess what happens? |
| The safest way to examine patterns is to consider them as tests. Tests that occur at crucial points as determined by critical areas found on charts. More often than not certain patterns follow their bullish or bearish intent BUT not always- we all know this. There are whipsaws and false moves scattered among the patterns. That is why traders should always keep an open mind and try to get a weight of evidence pointing in a clearer direction. In this way we try to tilt the odds in our favour. Pattern failure at crucial tests still give a powerful trading signal. |

|
| Graphic provided by: StockCharts.com. |
| |
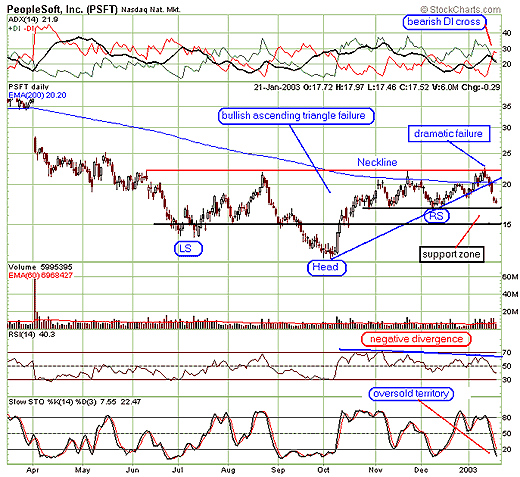
| PSFT's chart shows the potential of two bullish patterns. A bullish ascending triangle and a head and shoulders bottom. With so many traders anticipating a bullish conclusion, the move was tradeable as soon as it was clear that the expected result didn't materialize. All of a sudden traders realized the bear trap and many rushed to bail out of their bullish positions leading to a dramatic failure. Adding to that would be pressure from short sellers correctly seeing the "failure move." The market chose to surprise the bulls with what now looks like a triple top failure. |
| There was at least one good clue besides the uncertainty of the overall indices, that all was not well with the bullish test. Note the negative divergence shown via the RSI indicator. The new high test was not confirmed by a higher RSI - this was a good warning sign that all was not well. |
| As the stock fell below the 200-day EMA and the indicators worsened (stochastic downturn and DI cross on top ADX indicator), conditions quickly worsened until the bottom trendline was violated. This was an excellent trading signal for the patient/prudent trader to bail out of their positions and short signals for others. With the stochastics indicator moving into oversold conditions, a bounce may ensue in the support zone as indicated on the chart. Something to watch for in the days ahead. Watching and waiting for good moves to appear is often the name of the game. Whether they are pattern successes or failures doesn't really matter to the traders looking for "elephant tracks" and then simply following them. |
Independent Canadian equities trader and technical analyst based in Peterborough
Ontario, Canada.
| Website: | www.whatsonsale.ca/financial.html |
| E-mail address: | gwg7@sympatico.ca |
Click here for more information about our publications!
PRINT THIS ARTICLE

Request Information From Our Sponsors
- VectorVest, Inc.
- Executive Premier Workshop
- One-Day Options Course
- OptionsPro
- Retirement Income Workshop
- Sure-Fire Trading Systems (VectorVest, Inc.)
- Trading as a Business Workshop
- VectorVest 7 EOD
- VectorVest 7 RealTime/IntraDay
- VectorVest AutoTester
- VectorVest Educational Services
- VectorVest OnLine
- VectorVest Options Analyzer
- VectorVest ProGraphics v6.0
- VectorVest ProTrader 7
- VectorVest RealTime Derby Tool
- VectorVest Simulator
- VectorVest Variator
- VectorVest Watchdog
- StockCharts.com, Inc.
- Candle Patterns
- Candlestick Charting Explained
- Intermarket Technical Analysis
- John Murphy on Chart Analysis
- John Murphy's Chart Pattern Recognition
- John Murphy's Market Message
- MurphyExplainsMarketAnalysis-Intermarket Analysis
- MurphyExplainsMarketAnalysis-Visual Analysis
- StockCharts.com
- Technical Analysis of the Financial Markets
- The Visual Investor
