

HOT TOPICS LIST
- MACD
- Fibonacci
- RSI
- Gann
- ADXR
- Stochastics
- Volume
- Triangles
- Futures
- Cycles
- Volatility
- ZIGZAG
- MESA
- Retracement
- Aroon
INDICATORS LIST
LIST OF TOPICS
PRINT THIS ARTICLE
by Stella Osoba, CMT
Over the past few years Paypal (PYPL) has been a mostly money losing stock for anyone who held shares long. So what's next for the stock?
Position: N/A
Stella Osoba, CMT
Stella Osoba is a trader and financial writer. She is a frequent contributor to "Technical Analysis of Stocks and Commodities" magazine and "Traders.com Advantage" as well as other financial publications.
PRINT THIS ARTICLE
ROUND TOP & BOTTOM
What's Next for PayPal?
05/22/25 02:04:15 PMby Stella Osoba, CMT
Over the past few years Paypal (PYPL) has been a mostly money losing stock for anyone who held shares long. So what's next for the stock?
Position: N/A
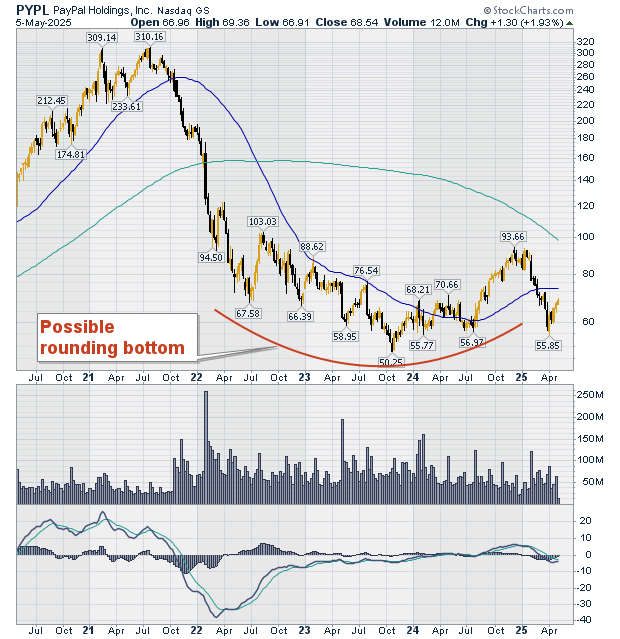
| Figure 1 is a weekly chart of PYPL showing five years of price history. We can clearly see the double top that formed when the stock was trading at a high of $310. After the second high completed its formation in July 2021, the stock began a long descent to close at a low of $50.25 in October 2023. That is an 84% decline. |
|
| Figure 1. Weekly chart for PYPL. |
| Graphic provided by: StockCharts.com. |
| |
| With this magnitude of share price loss, is there any reason to now go long the stock? Are there any rays of hope for a turnaround of the stock? To decipher this, we must study the chart. |
| Figure 1 shows the stock currently making a rounding bottom formation. A rounding bottom chart pattern, also called a saucer pattern, is a long-term reversal pattern that is best spotted on a weekly chart. PYPL's pattern fits into the classic requirements for a rounding bottom. The first part of the pattern is a series of jagged lows which ends when a new low is formed. The second part of the pattern is another series of jagged lows which rise to form the right part of the rounding bottom. |
| The breakout from this type of pattern is important. Breakout comes when price rises above the reaction high at the beginning of the pattern (see chart). This breakout should be on significantly higher volume, which means volume that is two to three times that of the prior week. Until that happens (if it does), it's best to just put the stock on your watch list. |
| Once the breakout has happened, this level might become new support allowing for an entry with a sensible stop below support. |
Stella Osoba is a trader and financial writer. She is a frequent contributor to "Technical Analysis of Stocks and Commodities" magazine and "Traders.com Advantage" as well as other financial publications.
| E-mail address: | stellaosoba@gmail.com |
Click here for more information about our publications!
PRINT THIS ARTICLE

Request Information From Our Sponsors
- VectorVest, Inc.
- Executive Premier Workshop
- One-Day Options Course
- OptionsPro
- Retirement Income Workshop
- Sure-Fire Trading Systems (VectorVest, Inc.)
- Trading as a Business Workshop
- VectorVest 7 EOD
- VectorVest 7 RealTime/IntraDay
- VectorVest AutoTester
- VectorVest Educational Services
- VectorVest OnLine
- VectorVest Options Analyzer
- VectorVest ProGraphics v6.0
- VectorVest ProTrader 7
- VectorVest RealTime Derby Tool
- VectorVest Simulator
- VectorVest Variator
- VectorVest Watchdog
- StockCharts.com, Inc.
- Candle Patterns
- Candlestick Charting Explained
- Intermarket Technical Analysis
- John Murphy on Chart Analysis
- John Murphy's Chart Pattern Recognition
- John Murphy's Market Message
- MurphyExplainsMarketAnalysis-Intermarket Analysis
- MurphyExplainsMarketAnalysis-Visual Analysis
- StockCharts.com
- Technical Analysis of the Financial Markets
- The Visual Investor