

HOT TOPICS LIST
- MACD
- Fibonacci
- RSI
- Gann
- ADXR
- Stochastics
- Volume
- Triangles
- Futures
- Cycles
- Volatility
- ZIGZAG
- MESA
- Retracement
- Aroon
INDICATORS LIST
LIST OF TOPICS
PRINT THIS ARTICLE
by Stella Osoba, CMT
Will quantum computing be the disruptor some hope it will be? With Microsoft in the news for its quantum computing breakthrough, now is the time to take a look at one of the lesser players in this space.
Position: N/A
Stella Osoba, CMT
Stella Osoba is a trader and financial writer. She is a frequent contributor to "Technical Analysis of Stocks and Commodities" magazine and "Traders.com Advantage" as well as other financial publications.
PRINT THIS ARTICLE
TECHNICAL ANALYSIS
Quantum Computing
03/19/25 01:40:55 PMby Stella Osoba, CMT
Will quantum computing be the disruptor some hope it will be? With Microsoft in the news for its quantum computing breakthrough, now is the time to take a look at one of the lesser players in this space.
Position: N/A
| Quantum computing uses qubits to process large amounts of data simultaneously and at much faster speeds than classical computers. This means that when it comes to processing complex mathematical problems and large data, quantum computers will have an advantage. But the technology is still in its early stages of development and there are some challenges that need to be ironed out before there is any likelihood of widespread adoption. |
| Nevertheless, companies are emerging in this space because of quantum computing's potential ability to be a market disruptor, and it will be worthwhile paying attention to them. One such company is D-Wave Quantum Incs. (QBTS). QBTS is a small/mid-cap company that develops quantum computers. It was founded in 2022 in Palo Alto, California. |
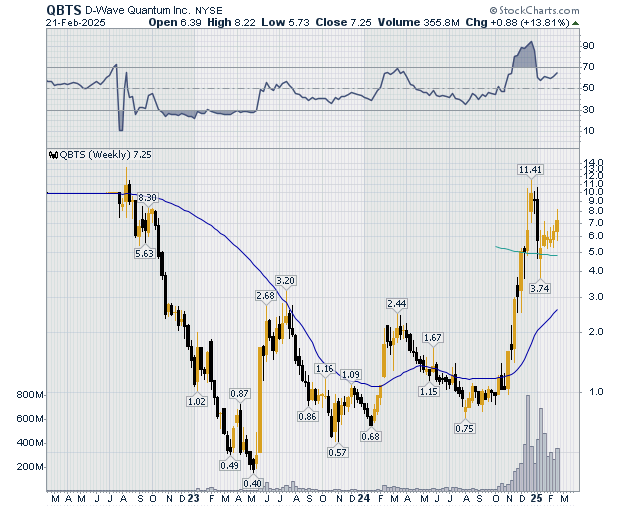
| Figure 1 is a weekly chart of QBTS showing price history from July 2022 to the present. Shortly after its August 8, 2022 IPO when shares were offered for $8.98 each, price entered a steep downtrend. This lasted from 2022 until May of 2023 when price found its bottom at $0.40. Price then traded mostly sideways, making a series of higher lows. 2024 would prove to be a breakout year for the stock. From a low of $0.75 in August 2024, price went on to breakout, forming a parabolic uptrend, rising to $11.41 in December of that year. |
|
| Figure 1. Weekly chart for QBTS. |
| Graphic provided by: StockCharts.com. |
| |
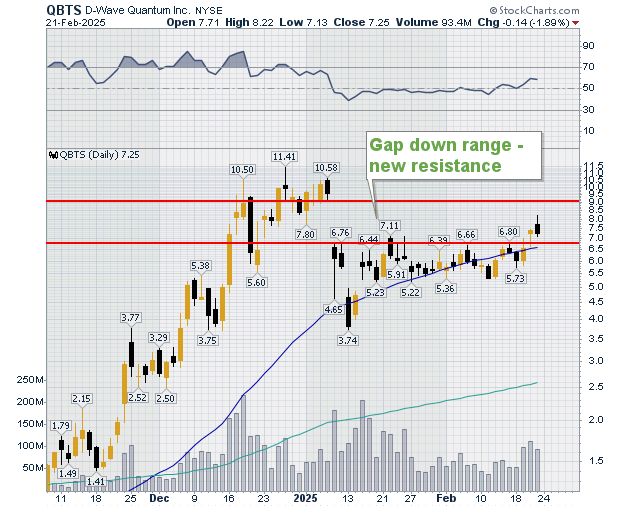
| Shortly after the December high of $11.41, price gapped down (see Figure 2) and proceeded to trade sideways as it moved towards its 50-day moving average. The whole area of the gap down now becomes resistance for price. |
|
| Figure 2. Daily chart for QBTS. |
| Graphic provided by: StockCharts.com. |
| |
| How price resolves at this area of resistance will be significant in understanding the strength of this stock. A break above the area of resistance will turn the top of the area of resistance into new support. One thing worth noting is that even with its parabolic uptrend, price has not yet broken above its prior all-time high of $13.23 which was reached in August 2022. This is also worth paying attention to. A break to new all-time highs could mean a new uptrend for the stock. |
Stella Osoba is a trader and financial writer. She is a frequent contributor to "Technical Analysis of Stocks and Commodities" magazine and "Traders.com Advantage" as well as other financial publications.
| E-mail address: | stellaosoba@gmail.com |
Click here for more information about our publications!
PRINT THIS ARTICLE

Request Information From Our Sponsors
- StockCharts.com, Inc.
- Candle Patterns
- Candlestick Charting Explained
- Intermarket Technical Analysis
- John Murphy on Chart Analysis
- John Murphy's Chart Pattern Recognition
- John Murphy's Market Message
- MurphyExplainsMarketAnalysis-Intermarket Analysis
- MurphyExplainsMarketAnalysis-Visual Analysis
- StockCharts.com
- Technical Analysis of the Financial Markets
- The Visual Investor
- VectorVest, Inc.
- Executive Premier Workshop
- One-Day Options Course
- OptionsPro
- Retirement Income Workshop
- Sure-Fire Trading Systems (VectorVest, Inc.)
- Trading as a Business Workshop
- VectorVest 7 EOD
- VectorVest 7 RealTime/IntraDay
- VectorVest AutoTester
- VectorVest Educational Services
- VectorVest OnLine
- VectorVest Options Analyzer
- VectorVest ProGraphics v6.0
- VectorVest ProTrader 7
- VectorVest RealTime Derby Tool
- VectorVest Simulator
- VectorVest Variator
- VectorVest Watchdog