

HOT TOPICS LIST
- MACD
- Fibonacci
- RSI
- Gann
- ADXR
- Stochastics
- Volume
- Triangles
- Futures
- Cycles
- Volatility
- ZIGZAG
- MESA
- Retracement
- Aroon
INDICATORS LIST
LIST OF TOPICS
PRINT THIS ARTICLE
by Stella Osoba, CMT
Nike (NKE) is one of the top footwear manufacturing companies in the world. Over the last three years, its share price has been in a noticeable downtrend. What's next for this stock?
Position: N/A
Stella Osoba, CMT
Stella Osoba is a trader and financial writer. She is a frequent contributor to "Technical Analysis of Stocks and Commodities" magazine and "Traders.com Advantage" as well as other financial publications.
PRINT THIS ARTICLE
TECHNICAL ANALYSIS
What's Next for Nike?
03/19/25 01:35:57 PMby Stella Osoba, CMT
Nike (NKE) is one of the top footwear manufacturing companies in the world. Over the last three years, its share price has been in a noticeable downtrend. What's next for this stock?
Position: N/A
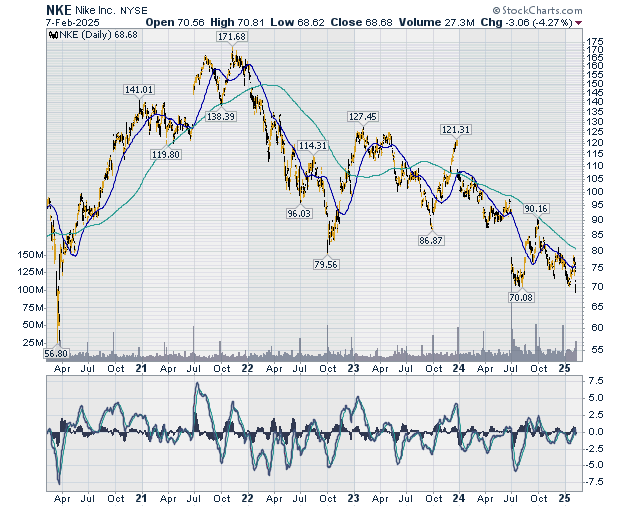
| Figure 1 is a daily chart of NKE showing about three years of price history. We can see NKE hitting its price high in November 2021. After that it was a steep ride downhill. Price fell to lows of $70.08 in August of 2024. As price looks set to test those lows, now would be a good time to revisit this chart study. |
|
| Figure 1. Daily chart for NKE showing last 3 years. |
| Graphic provided by: StockCharts.com. |
| |
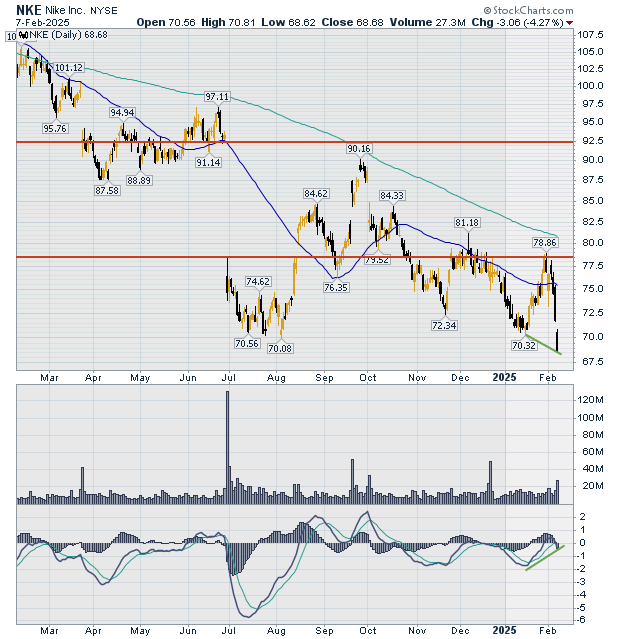
| Figure 2 is a daily chart of NKE showing a close up view of one year of price history. We can clearly see NKE's price falling to new lows. The test of the prior low touched in August 2024 failed in February 2025. On February 7, 2025 price gapped down to form a new low of $68.62, meaning that the floor created by the prior low has failed. |
|
| Figure 2. Daily chart for NKE showing last 1 year. |
| Graphic provided by: StockCharts.com. |
| |
| So what does this mean for the stock's price? If what we are looking at is the formation of a double bottom, then the lower low on the second bottom is not necessarily a bad thing. When price is testing lows, it can sometimes overshoot a prior low while support still generally holds. |
| Could that be the case here? While it is possible, there is no definitive way to say for sure without further price action. One thing to be aware of is the positive divergence shown by price and the MACD indicator. A positive divergence is when price makes a lower low, but the indicator, in this case the MACD, does not. The green lines on price and the indicator which is in the panel below price marks the divergence. |
| There is still a lot of bearishness that price will need to overcome to justify a long position in the stock. Figure 2 shows the large area of resistance that price has been unable to breach despite several attempts. This area of resistance which is marked by two horizontal red lines on the chart was formed in June when price gapped down from $93.84 to $78.30. To close the gap, price would have to rise above the area formed by the gap down to close above the highest price formed by the gap. |
Stella Osoba is a trader and financial writer. She is a frequent contributor to "Technical Analysis of Stocks and Commodities" magazine and "Traders.com Advantage" as well as other financial publications.
| E-mail address: | stellaosoba@gmail.com |
Click here for more information about our publications!
PRINT THIS ARTICLE

Request Information From Our Sponsors
- StockCharts.com, Inc.
- Candle Patterns
- Candlestick Charting Explained
- Intermarket Technical Analysis
- John Murphy on Chart Analysis
- John Murphy's Chart Pattern Recognition
- John Murphy's Market Message
- MurphyExplainsMarketAnalysis-Intermarket Analysis
- MurphyExplainsMarketAnalysis-Visual Analysis
- StockCharts.com
- Technical Analysis of the Financial Markets
- The Visual Investor
- VectorVest, Inc.
- Executive Premier Workshop
- One-Day Options Course
- OptionsPro
- Retirement Income Workshop
- Sure-Fire Trading Systems (VectorVest, Inc.)
- Trading as a Business Workshop
- VectorVest 7 EOD
- VectorVest 7 RealTime/IntraDay
- VectorVest AutoTester
- VectorVest Educational Services
- VectorVest OnLine
- VectorVest Options Analyzer
- VectorVest ProGraphics v6.0
- VectorVest ProTrader 7
- VectorVest RealTime Derby Tool
- VectorVest Simulator
- VectorVest Variator
- VectorVest Watchdog