

HOT TOPICS LIST
- MACD
- Fibonacci
- RSI
- Gann
- ADXR
- Stochastics
- Volume
- Triangles
- Futures
- Cycles
- Volatility
- ZIGZAG
- MESA
- Retracement
- Aroon
INDICATORS LIST
LIST OF TOPICS
PRINT THIS ARTICLE
by Stella Osoba, CMT
After the Trump and Melania meme coins were launched on Solana's blockchain, Solana hit an all-time high in January 2025 of $294.95, surpassing its prior highs of $259.95 set in November 2021.
Position: N/A
Stella Osoba, CMT
Stella Osoba is a trader and financial writer. She is a frequent contributor to "Technical Analysis of Stocks and Commodities" magazine and "Traders.com Advantage" as well as other financial publications.
PRINT THIS ARTICLE
TECHNICAL ANALYSIS
Meme Coins and Solana
02/27/25 01:51:54 PMby Stella Osoba, CMT
After the Trump and Melania meme coins were launched on Solana's blockchain, Solana hit an all-time high in January 2025 of $294.95, surpassing its prior highs of $259.95 set in November 2021.
Position: N/A
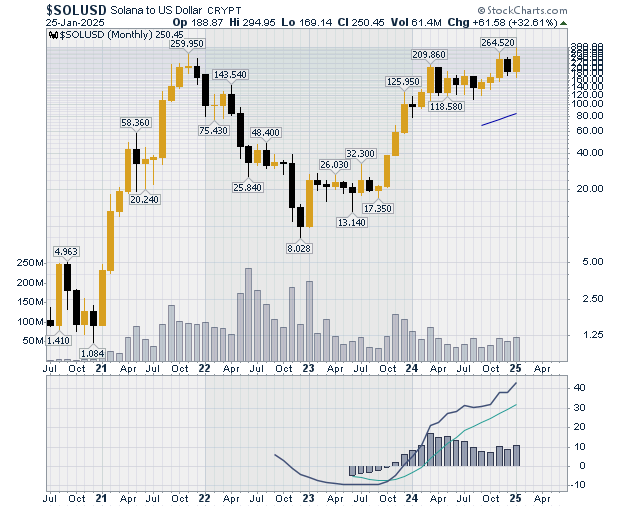
| Figure 1 is a monthly chart of Solana ($SOLUSD) showing its lifetime price history. Price launched on a meteoric rise from a low of $1.08 in December 2020 to a nose-bleed high of $259.95 in November 2021. Then, through 2022, price gave up its gains, plunging to a low of $8.02 in December of that year. 2023 was a lackluster year until the fourth quarter. Price mostly traded sideways showing listless price action before signs of life occurred as price rose to $125.95 by the end of that year. |
|
| Figure 1: Weekly chart for $SOLUSD. |
| Graphic provided by: StockCharts.com. |
| |
| The price rise that started in the fourth quarter of 2023 continued into 2024 and price topped at $209.86 before proceeding with more sideways action for the bulk of the remainder of the year. |
| The next time anything of note happened was in November 2024 when price broke out to touch a new high of $264.52. And then the Trump meme coin announcement happened on January 17, 2024. |
|
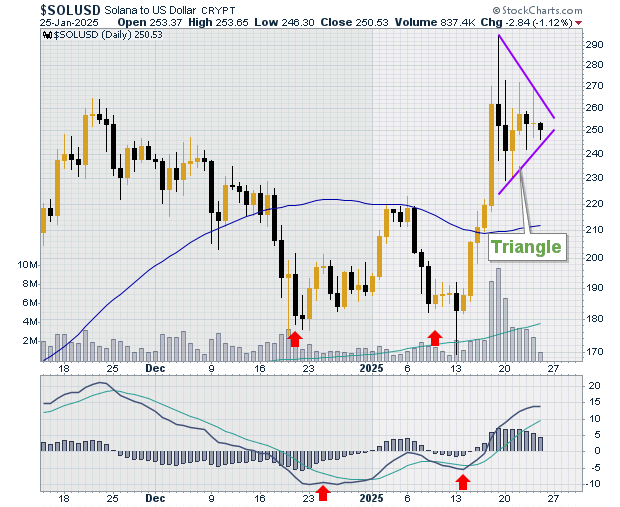
| Figure 2: Daily chart for $SOLUSD. |
| Graphic provided by: StockCharts.com. |
| |
| Figure 2 is a daily chart of $SOLUSD showing price breakout from a double bottom pattern (pattern is indicated by the red arrows on chart). Price had been rising when the announcement of the meme coins was made. As the market caps of the Trump and Melania meme coins rose on exuberant price action, Solana also rose as the meme coins were launched on the token's native blockchain. |
| Figure 2 shows that price has formed a triangle on decreasing volume. A triangle is a continuation pattern. Traders will be watching to how price breaks out of the pattern |
Stella Osoba is a trader and financial writer. She is a frequent contributor to "Technical Analysis of Stocks and Commodities" magazine and "Traders.com Advantage" as well as other financial publications.
| E-mail address: | stellaosoba@gmail.com |
Click here for more information about our publications!
PRINT THIS ARTICLE

Request Information From Our Sponsors
- StockCharts.com, Inc.
- Candle Patterns
- Candlestick Charting Explained
- Intermarket Technical Analysis
- John Murphy on Chart Analysis
- John Murphy's Chart Pattern Recognition
- John Murphy's Market Message
- MurphyExplainsMarketAnalysis-Intermarket Analysis
- MurphyExplainsMarketAnalysis-Visual Analysis
- StockCharts.com
- Technical Analysis of the Financial Markets
- The Visual Investor
- VectorVest, Inc.
- Executive Premier Workshop
- One-Day Options Course
- OptionsPro
- Retirement Income Workshop
- Sure-Fire Trading Systems (VectorVest, Inc.)
- Trading as a Business Workshop
- VectorVest 7 EOD
- VectorVest 7 RealTime/IntraDay
- VectorVest AutoTester
- VectorVest Educational Services
- VectorVest OnLine
- VectorVest Options Analyzer
- VectorVest ProGraphics v6.0
- VectorVest ProTrader 7
- VectorVest RealTime Derby Tool
- VectorVest Simulator
- VectorVest Variator
- VectorVest Watchdog