HOT TOPICS LIST
- MACD
- Fibonacci
- RSI
- Gann
- ADXR
- Stochastics
- Volume
- Triangles
- Futures
- Cycles
- Volatility
- ZIGZAG
- MESA
- Retracement
- Aroon
INDICATORS LIST
LIST OF TOPICS
PRINT THIS ARTICLE
by Koos van der Merwe
In the good old days, long before Enronitis, a company's worth was measured by its earnings per share. Then along came Microsoft and changed the way we looked at a company.
Position: Hold
Koos van der Merwe
Has been a technical analyst since 1969, and has worked as a futures and options trader with First Financial Futures in Johannesburg, South Africa.
PRINT THIS ARTICLE
VOLUME
Microsoft: Where Will It Go?
01/21/03 02:06:18 PMby Koos van der Merwe
In the good old days, long before Enronitis, a company's worth was measured by its earnings per share. Then along came Microsoft and changed the way we looked at a company.
Position: Hold
| Microsoft made the decision to use profits for further research and growth rather than paying a dividend. And investors liked that, pushing the shares to unbelievable heights with numerous splits along the way. Other companies followed suit, a strategy that culminated in a number of companies meeting the "whisper number" by fudging the bottom number on the balance sheet. Today dividends are back in fashion, only because you cannot fudge cash, but why did Microsoft offer such a pesky dividend? |
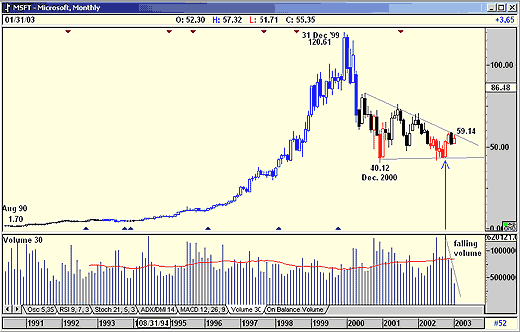
| Charts are not telling us much. A look at the monthly chart shows how a purchase of Microsft for $1.70 (adjusted for splits) in August 1990 would have been worth $120.61 nine years later - not bad for a company that never paid a dividend. Since December 1999, the share fell by more than 50% to $40.12 by December 2000. From that day it appears to be consolidating in a triangle that could be a reversal pattern because of the triangle's horizontal base. If this is indeed so, then Microsoft would have to break out at $59.14, and the share was going there, gradually creeping up to the resistance level. Then came the dividend announcement, coupled with the announcement that a share split would take place, and that future results may not meet expectations, and wham! The price fell. |

|
| Figure 1: Monthly chart of Microsoft. |
| Graphic provided by: AdvancedGET. |
| |
| But let me examine these statements from a technical level. 1. Dividend announcement. Microsoft declared $0.18 per share. At a price of $55 at the time of declaration, the dividend is piddling, and almost an insult to the investment community. However, it has come immediately after George Bush's announcement that he would push for the cancellation of double taxation of dividends. Also Microsoft stated "this is only a beginning." 2. The split. It is well known that when a stock declares a split, the price starts rising. The reason is that after a split occurs, the cheaper price brings more buyers into the market which in turn pushes up the price. 3. Caution on future earnings. In all the years that I have watched Microsoft, they have ALWAYS issued a cautious warning on future earnings in their announcement. The share has ALWAYS been knocked by analysts who simply don't seem to learn or don't want to learn. Microsoft has always met the whisper number, if not exceeded it. Whether they do this by manipulating cash on hand, or whether it is genuine, they have never missed a target. Why should they now? We all know that Microsoft is sitting on a ton of cash, probably in anticipation of losing one or two court cases. With recent settlements, the cash they would have used to settle cases, has become more visible, so they can pass on the excess. One must also remember that Microsoft does have a corner in the market on operating system software. Other systems like Java and Linux do exist, but there are as yet, not enough software to make them attractive to the unsophisticated investor. One has simply to look at Redhat, (RHAT) to find out how well Linux is doing, and Redhat shares are struggling at the moment. |
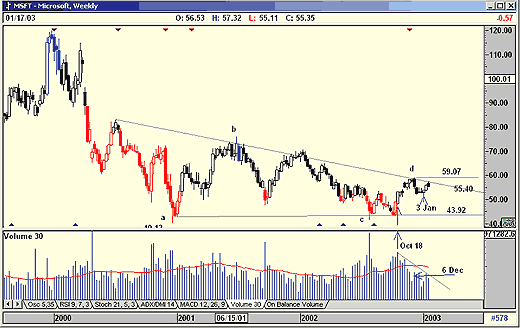
The first chart is a monthly chart of Microsoft. Note that when the share price rose, the volume was high, and that with the recent dividend announcement, although the share price fell, it fell on not just below average volume, but extremely low volume. The volume rule states, a falling price on low volume equals strength, so is it time then to buy Microsoft? Figure 2: Weekly chart of Microsoft. The weekly chart however, tells a slightly different story. It shows the triangle, as expected, but tells me that I can expect wave "e" to be down, and test the support level at $43.92 before either breaking down, or moving up to the resistance line of approximately $55.40. The chart also shows me that volume started falling soon after October 18th and initially on rising prices. The rule? A rising price on falling volume equals weakness. I also see that on December 6th, the price fell on below average volume, but volume was still slightly higher than the previous day. Not impressive enough to confirm anything, but telling me that there is a great deal of uncertainty, with investors neither buying nor selling other than the speculator. From January 3rd, prices and volume did start rising, but were nothing to shout about. |
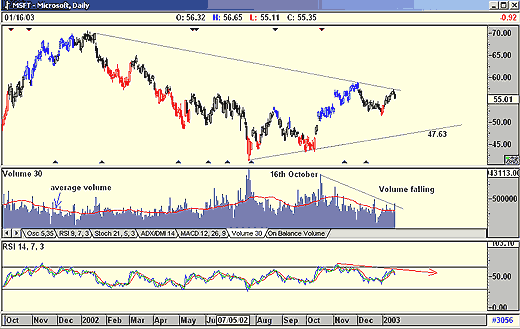
 Figure 3: Daily chart of Microsoft. Finally, the daily chart shows that from October 16th, volume has been falling, with the odd day kicking above average.(Note, the red line is a 30-day moving average of the volume.) However, for the short-term (see red arrow), the volume has been rising on a rising price, suggesting strength for the short-term. The RSI indicator is trending down as shown on the chart, which is a contradiction in the short-term. To conclude, I would not buy Microsoft at present levels, but neither would I sell. Hold and watch. Should the price break above $57.43, then BUY, but should it fall below $51.51, sell, and expect it to test the lower support line at approximately $47.63. Once the share has split, it may give a more definite BUY signal, so do watch for an opportunity. By declaring the dividend, as meager as it is, we are being told something. Time will tell what it is. |
Has been a technical analyst since 1969, and has worked as a futures and options trader with First Financial Futures in Johannesburg, South Africa.
| Address: | 3256 West 24th Ave |
| Vancouver, BC | |
| Phone # for sales: | 6042634214 |
| E-mail address: | petroosp@gmail.com |
Click here for more information about our publications!
PRINT THIS ARTICLE

Request Information From Our Sponsors
- VectorVest, Inc.
- Executive Premier Workshop
- One-Day Options Course
- OptionsPro
- Retirement Income Workshop
- Sure-Fire Trading Systems (VectorVest, Inc.)
- Trading as a Business Workshop
- VectorVest 7 EOD
- VectorVest 7 RealTime/IntraDay
- VectorVest AutoTester
- VectorVest Educational Services
- VectorVest OnLine
- VectorVest Options Analyzer
- VectorVest ProGraphics v6.0
- VectorVest ProTrader 7
- VectorVest RealTime Derby Tool
- VectorVest Simulator
- VectorVest Variator
- VectorVest Watchdog
- StockCharts.com, Inc.
- Candle Patterns
- Candlestick Charting Explained
- Intermarket Technical Analysis
- John Murphy on Chart Analysis
- John Murphy's Chart Pattern Recognition
- John Murphy's Market Message
- MurphyExplainsMarketAnalysis-Intermarket Analysis
- MurphyExplainsMarketAnalysis-Visual Analysis
- StockCharts.com
- Technical Analysis of the Financial Markets
- The Visual Investor
